9 of 10 Years Down: Workday, Inc. (WDAY) Enters a Historically Weak September Window
Workday, Inc. is heading into a short early-September stretch that has been unusually weak in past years, just as the stock trades well below its 52-week high but still up year to date.
Price as of Sep 1, 2026: $198.38 (last close).

What is the seasonal pattern for Workday, Inc. (WDAY)?
Workday, Inc. has fallen in 9 of 10 years during this early-September 12-day window, with an average 3.33% gain in winning years for the short-side pattern.
- 9 for 10 in this window, with the short-side pattern averaging 3.33% profit in winning years and 3% across all years.
- The upcoming Sep 3 to Sep 14 trading window has been a historically weak stretch for WDAY’s share price, favoring short exposure.
- Percent Profitable sits at 90%, with 9 winning years and just 1 losing year for the short-direction setup.
- Avg Profit reflects winners only at 3.33%, while Avg Profit - All, which includes the lone losing year, comes in at 3%.
- The TradeWave Ratio of 1.67 suggests price has typically moved meaningfully in the trade direction within the window, even when final closes vary.
- Intraperiod swings have included sizable adverse moves in some years, so short setups have faced real drawdown risk before paying off.
According to historical data from TradeWave.ai, this short early-September stretch has behaved very differently from an average month in Workday’s trading year. The next section looks at how that pattern has played out over the past decade and what it means as the 2026 window opens.
How has Workday, Inc. (WDAY) traded in this early-September window?
Workday, Inc. has closed lower in 9 of the past 10 years between Sep 3 and Sep 14, with the short-side pattern posting an average 3.33% profit in winning years and 3% across all years. The 2026 window begins on Sep 3, with WDAY finishing the prior session at 198.38, about 20.6% below its 52-week high of 249.85 and still up 7.64% year to date. That combination of a historically soft slice of the calendar and a stock trading well off its highs but not washed out gives this year’s setup extra edge for traders watching the WDAY seasonal trend.
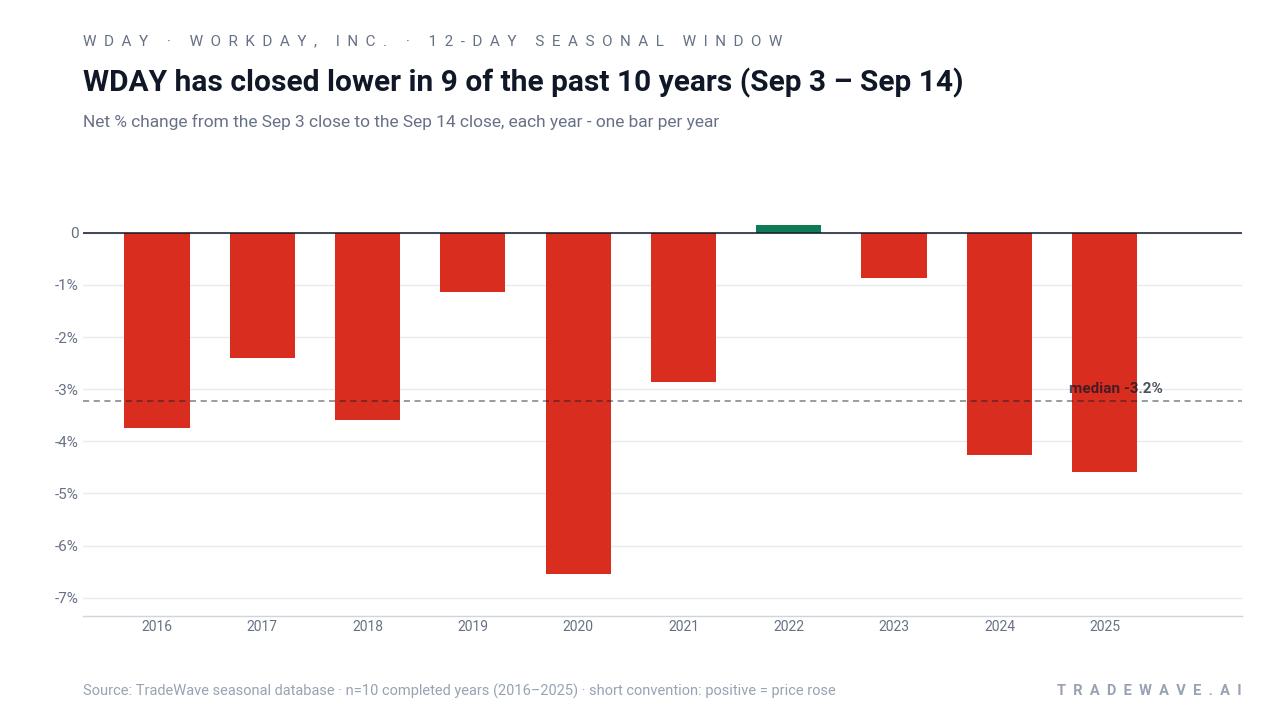
For this pattern, the trade direction is explicitly short, so years in which WDAY’s price fell over the window count as winners. Across the 10-year sample, Percent Profitable is 90%, with 9 winners and 1 loser, a striking hit rate for such a tight 12-day slice. Average profit in winning years is 3.33%, while including the lone losing year pulls Avg Profit - All to 3%, which still represents a solid seasonal edge for bears.
The per-year table shows how that has played out in practice. The strongest year for the short pattern was 2020, when WDAY dropped 6.54% between the Sep 3 entry at 223.00 and the Sep 14 exit at 208.41, after enduring a worst intraperiod drawdown of 9.69% from the entry. The weakest year for shorts was 2022, when the stock finished the window up 0.14%, with a best intraperiod gain of 8.18% from the entry and only a shallow 0.5% adverse move, making it the one year in the sample where fading this early-September stretch did not pay.
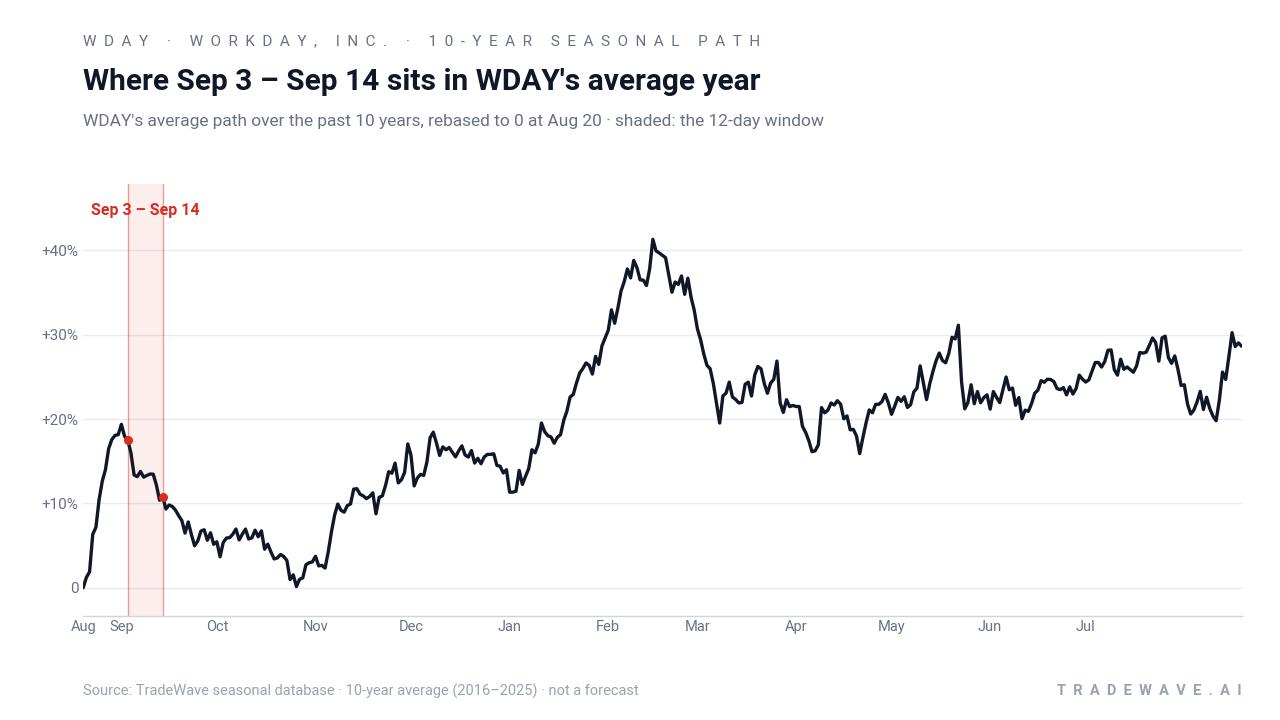
The historical seasonal average suggests that WDAY tends to roll over into this window rather than sell off from a standing start. In the composite path, the stock often trades sideways to slightly higher into late August, then drifts lower across the 12-day span, with most of the net move accruing in the middle of the window rather than in a single gap.
Yearly net and intraperiod swings highlight how often shorts have worked and how wide the trading range can be inside the window.
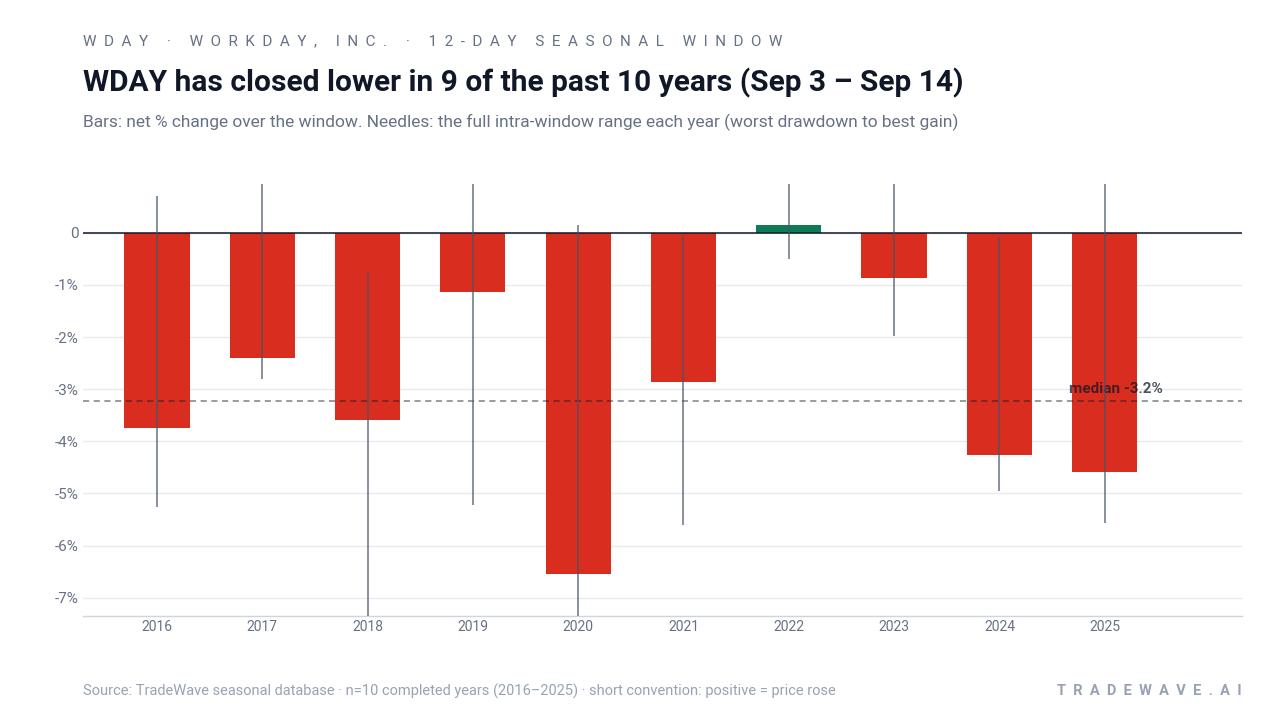
The stacked net, maximum favorable move and maximum adverse move chart shows why this pattern has appealed to active traders. In many years, the maximum favorable excursion in the short direction has been larger than the final net profit, which means intraperiod lows often overshoot the eventual close. At the same time, the worst adverse moves have sometimes been sizable, with several years showing 5% or more against the short before the pattern ultimately finished in the green.
History does not guarantee future results, and even in a strong seasonal window, adverse excursions can be large before any edge plays out.
Why does Workday, Inc. (WDAY) follow this seasonal pattern?
This early-September pattern for Workday may reflect a mix of post-earnings digestion and institutional portfolio repositioning in the software sector. The company typically reports around late August, which can leave analysts and large holders adjusting models and exposure in the following weeks as guidance and billings trends are absorbed. That kind of recalibration period often lines up with broader tech-sector rotation after summer, creating a recurring pocket of selling pressure in names like WDAY.
What is driving Workday, Inc. (WDAY) today?
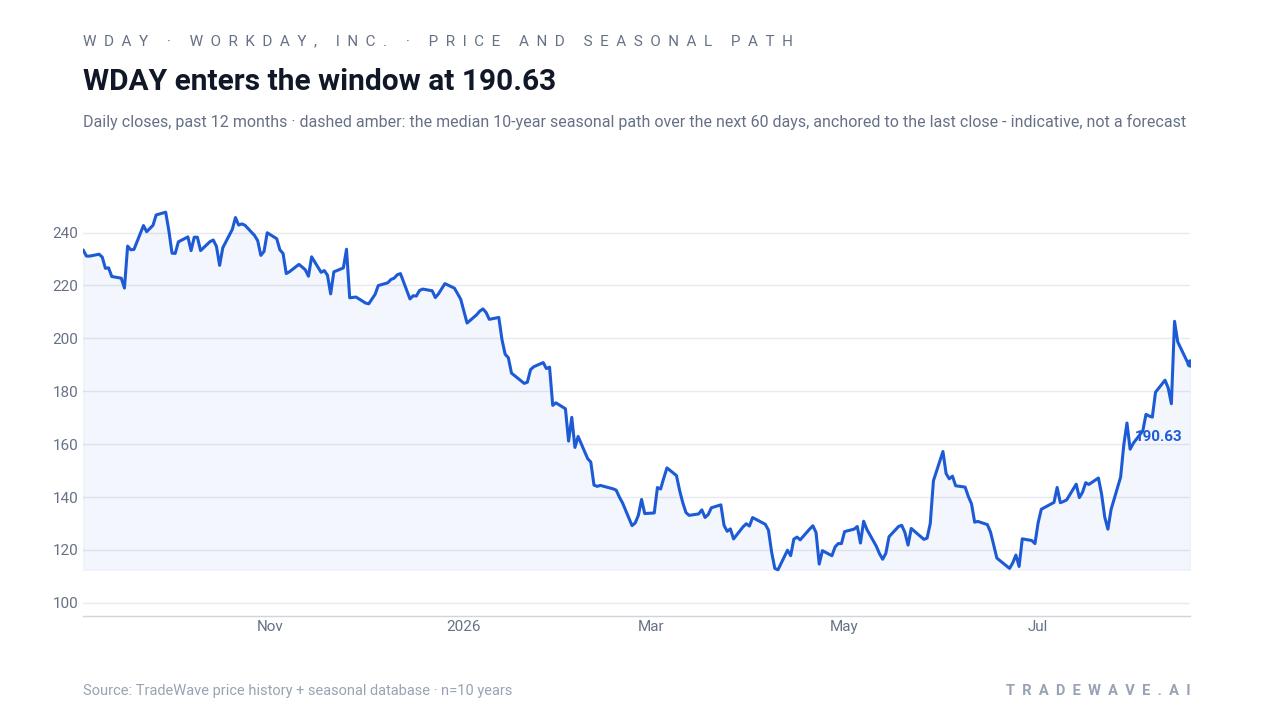
Workday shares closed the prior session at 198.38, up 0.47% on the day, leaving the stock about 20.6% below its 52-week high of 249.85 and well above its 52-week low of 110.36. The stock is ahead 7.64% so far in 2026, a modest gain that trails some high-growth software peers but still reflects steady demand for its cloud-based human capital and financial management tools.[1]
The latest fundamental checkpoint came on Aug 27, when Workday reported Q1 fiscal 2027 revenue of $2.54 billion and earnings of $222 million, for a profit margin of 8.73%.[1] That margin profile keeps Workday in the camp of scaled software platforms that are balancing growth investment with profitability, rather than chasing pure top-line expansion at any cost. The absence of explicit forward guidance in the disclosure leaves investors leaning more heavily on management commentary and broader tech sentiment to frame the next few quarters.[1]
On the Street, the stock carries a consensus Hold rating, with an aggregated price target of 206.68 from Yahoo Finance’s analyst compilation.[1] That target sits only modestly above the current price, suggesting that many covering analysts see Workday as fairly valued after its pullback from last year’s highs. With the shares trading below the 52-week peak but still comfortably above the lows, the setup looks like a classic mid-range consolidation rather than a clear trend in either direction.[1]
From a trading-activity standpoint, reported volume of 3.64 million shares compares with an average of about 4.93 million, so there has not been a flagged volume spike or unusual options or short-interest signal in the latest data.[1] That lack of a Special Insight on flows or positioning means the upcoming seasonal window stands out even more as a distinct feature of the WDAY trading calendar, rather than something layered on top of an already crowded speculative trade.
The chart below situates the latest move against the past year of trading and a median seasonal projection for the next two months.
What should traders watch in this Workday, Inc. (WDAY) window?
As the Sep 3 to Sep 14 window opens, the first thing to watch is whether WDAY respects its historical tendency to soften after late-August earnings. A quick fade from the 198 area toward prior support zones would be consistent with the past decade’s pattern, while a firm bid that pushes the stock back toward the low 200s would be an early sign that this year may break the mold.
Second, price behavior around the midpoint of the window matters. Historically, much of the net move has clustered in the middle days rather than at the open or close of the stretch. If the stock is still flat by around Sep 8 or Sep 9, that would mark a departure from the typical WDAY seasonal pattern and could signal that institutional flows are less synchronized this year.
Third, traders should keep an eye on volume and any emerging options or short-interest data. While the latest snapshot does not show a flagged volume spike or unusual positioning, a sudden pickup in activity during the window would add conviction that larger players are leaning into or against the historical seasonality.[1] A quiet tape with average volume would make any deviation from the pattern more likely to stick, since there would be less forced rebalancing to pull the stock back toward its usual path.
Finally, the broader software-sector backdrop will shape how much this 12-day stretch matters. If tech indices are firm and risk appetite is strong, a mild WDAY pullback in line with history might be shrugged off as noise. If the sector is already under pressure, a repeat of the deeper down years in this window could turn Workday into a focal point for investors reassessing cloud valuations into the autumn.
Sources
About this seasonal analysis
Seasonal pattern data is sourced from TradeWave.ai, which analyzes historical price behavior across annual calendar windows going back up to 30 years. Read the full data methodology or the book The 100-Year Pattern by Afshin Moshrefi (2026 edition). Past performance of seasonal patterns does not guarantee future results. This article is for informational purposes only and does not constitute investment advice.