Microsoft (MSFT) Has Risen in 9 of 9 Sep 5-Dec 1 Midterm Windows, Averaging 13.8% Gains
Microsoft is heading into an 88-day midterm-year window that has never been negative in the dataset, just as shares trade near record highs and investors debate how far the AI and cloud cycle can run.
Price as of Sep 3, 2026: $510.12 (last close).

What is the seasonal pattern for Microsoft (MSFT)?
Microsoft has risen in 9 of 9 midterm-year Sep 5 to Dec 1 windows, with an average gain of 13.8% in winning years.
- 9 for 9 in this window, averaging 13.8% gains in winning years across the last 9 midterm election cycles.
- Seasonal window runs from Sep 5 through Dec 1, spanning 88 calendar days in the late part of the midterm election year.
- Percent Profitable is 100%, with 9 winners and 0 losers in the historical sample.
- Median gain of 11.72% and cumulative return of 210% from repeatedly holding this Microsoft trading window over the sample.
- TradeWave Ratio of 1.87 and Sharpe ratio of 1.29 point to strong upside travel with risk-adjusted returns that have been favorable for long exposure.
- Intraperiod swings have still been meaningful, with some years showing double-digit drawdowns before finishing higher.
According to historical data from TradeWave.ai, this specific late midterm-year stretch in Microsoft has behaved very differently from an average quarter, and the next iteration begins this weekend.
How strong is Microsoft (MSFT) in the upcoming Sep 5 to Dec 1 window?
Microsoft has risen in 9 of the last 9 midterm election years during the Sep 5 to Dec 1 window, averaging 13.8% gains for long positions. Shares finished the prior session at 510.12, up 2.7% on the day and roughly 6.7% below their 52-week high of 546.77, after a choppy but positive year-to-date run. That puts a mega-cap already near the top of its range on the verge of entering a historically powerful seasonal stretch that has never produced a losing outcome in this dataset.
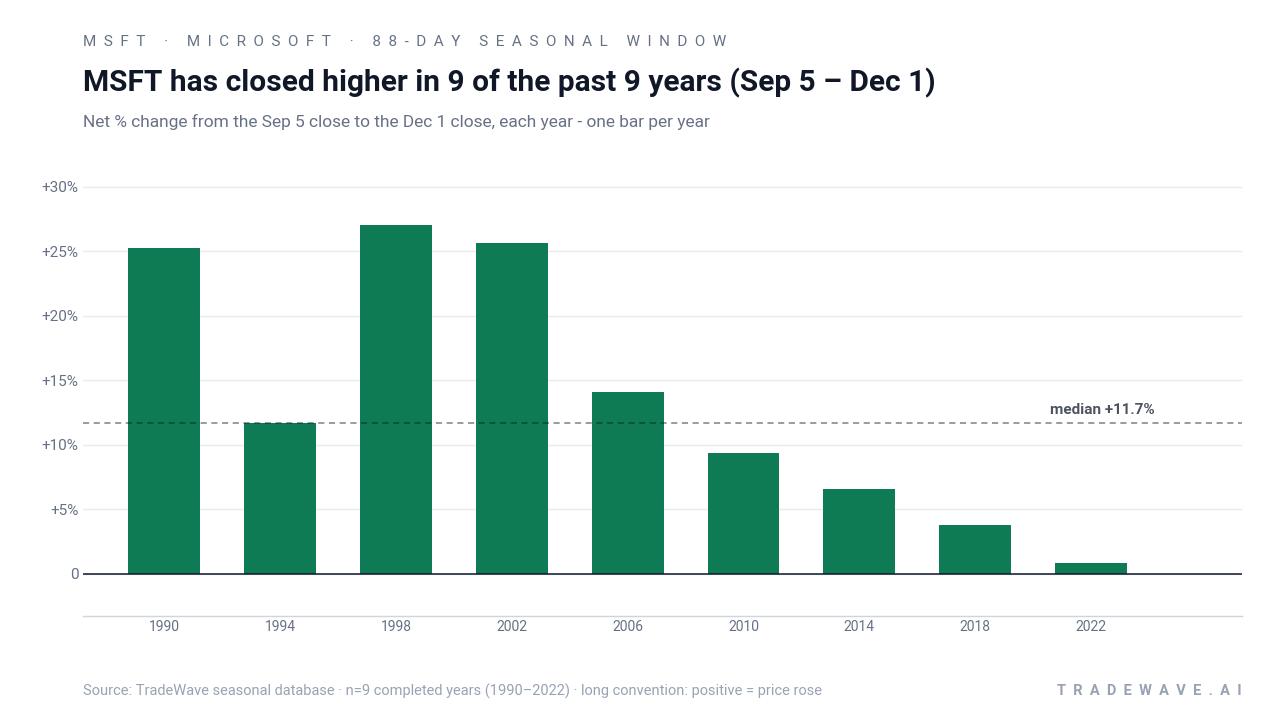
Because this pattern is grouped by the presidential election cycle, it reflects how Microsoft has behaved specifically in the late part of midterm election years, not just any autumn. That matters in 2026 because markets are concluding the midterm election year and will soon transition into the pre-election year, a phase that has often coincided with more supportive policy tone and risk-on positioning in large-cap tech.
A second view shows how much Microsoft has typically swung inside the window before finishing higher.
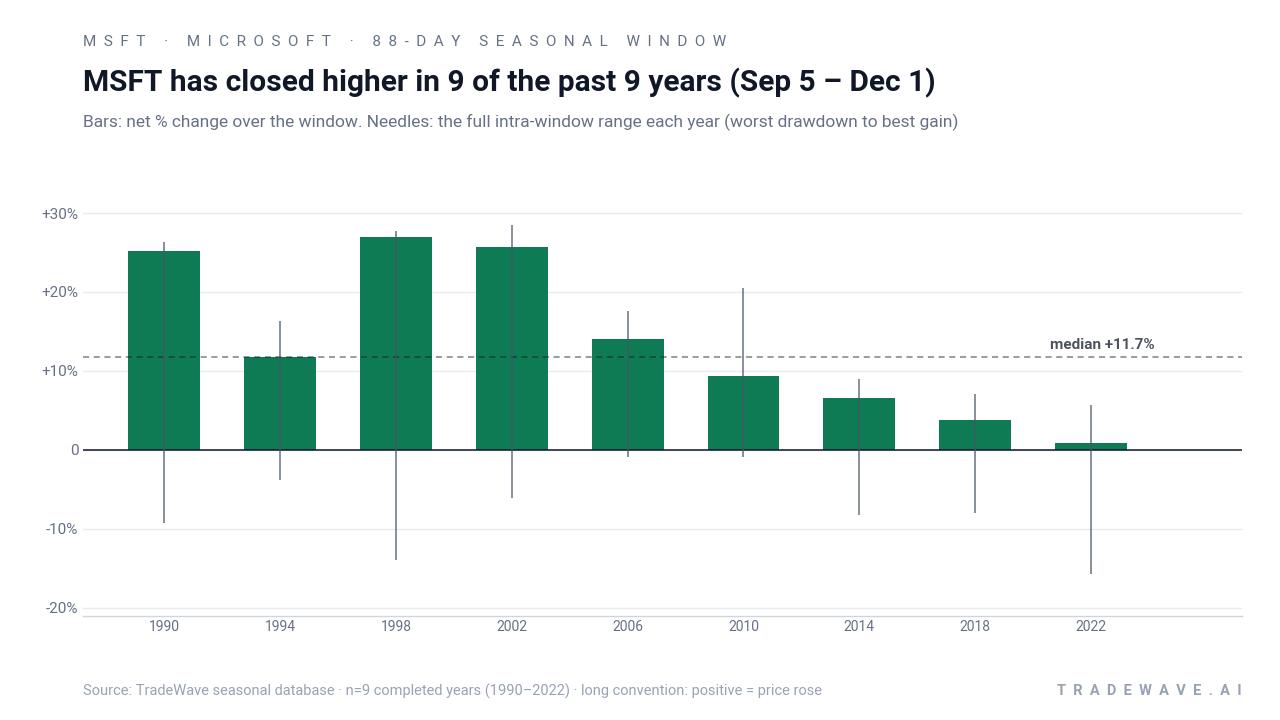
Across the nine midterm-year samples, the strongest Microsoft year in this window was 1998, when the stock gained 27.0% between Sep 5 and Dec 1 and at one point was up 27.75% from the entry while still enduring a 13.94% drawdown from that starting level. The softest outcome was 2022, which still finished positive at 0.85% but saw a worst intraperiod decline of 15.72% before recovering into the close. That mix of solid end-of-window gains and sometimes deep mid-window dips is what the TradeWave Ratio of 1.87 is capturing: price has tended to travel meaningfully in the long direction inside the window, even when the final net move is modest.
The per-year pattern is not just a single lucky decade. The sample spans from 1990 through 2022, with Microsoft posting double-digit gains in several cycles such as 1990, 1998, 2002 and 2006, and mid-single-digit advances in years like 2014 and 2018. Median profit of 11.72% sits slightly below the 13.8% average, which suggests a right tail of especially strong years rather than a few outliers masking weak typical performance.
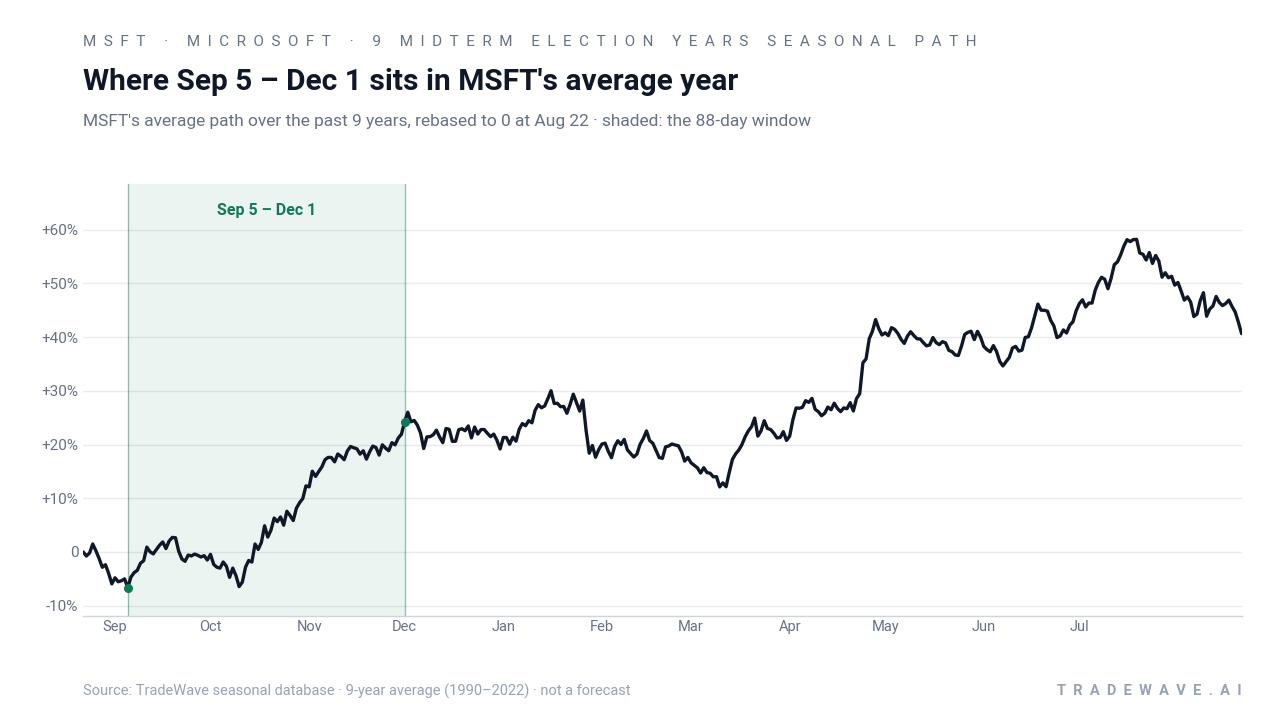
The historical seasonal average path shows returns tending to build as the window progresses rather than front-loading all the gains in September. That lines up with how midterm years often evolve for large-cap tech: volatility around policy and macro headlines early in the fall, followed by a steadier grind higher as the calendar moves toward year-end and investors position for the pre-election year.
Add it up: nine for nine with a 210% compounded gain across those windows is a rare record for a mega-cap stock in any election-cycle slice. History does not guarantee a repeat, but the consistency and magnitude of this Microsoft seasonal trend are hard to ignore.
Why does Microsoft (MSFT) follow this seasonal pattern?
One likely driver is the clustering of Microsoft’s fiscal Q1 earnings and guidance updates in this part of the year, which can reset expectations for Azure and AI growth. Analysts have also pointed to institutional portfolio repositioning around the midterm-to-pre-election transition, when large funds often add to secular winners in cloud and software as policy uncertainty clears.[2][7] The pattern may also reflect broader sector rotation into technology as year-end approaches and investors seek liquid, high-quality names to express risk-on views.
History does not guarantee future results; adverse excursions can be large even in winning windows, and Microsoft has previously seen double-digit drawdowns inside this pattern before finishing higher.
What is driving Microsoft (MSFT) today?
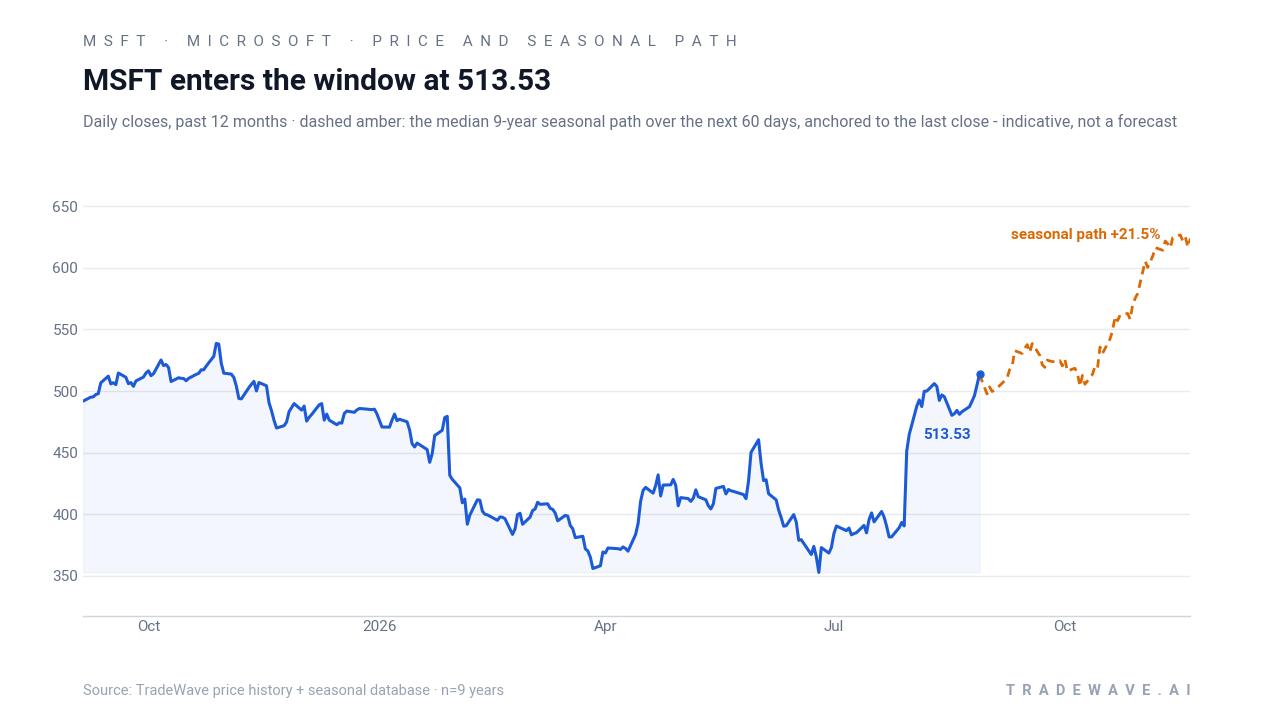
Microsoft closed Friday at 510.12, up 2.7% on the session and roughly 1.9% higher over the past month, leaving the stock about 6.7% below its 52-week high of 546.77 and modestly ahead for 2026 with a 2.73% year-to-date gain.[1][6] The move caps a summer defined by strong earnings, heavy AI and cloud spending, and a debate over how much hyperscaler capex is too much for investors’ comfort.[2][5][7]
On Jul 29, Microsoft reported fiscal Q4 2026 earnings per share of $4.74, beating estimates of $4.23 by 12.06%, extending a string of quarters where results topped expectations and Azure guidance remained robust.[5] In July, more than 60 analysts rated the stock a buy, with commentary highlighting Microsoft’s position as a top AI and cloud infrastructure play supported by a commercial remaining performance obligation of roughly $627 billion and sustained Azure growth expectations near 39% to 40% in constant currency.[2][5][7] At the same time, some analysts have “pumped the brakes” on the stock, citing hyperscaler capex running near $30.88 billion a quarter as both a competitive moat and a near-term overhang for free cash flow and valuation.[2]
That tension between powerful AI-driven growth and the sheer scale of required investment has defined Microsoft’s 2026 trading narrative. Bulls see a durable cloud and AI cycle with Microsoft at the center, while skeptics worry that even a high-quality franchise can struggle to outrun expectations when capex is this intense and the stock is already near record highs.[1][2][7]
The chart below situates the latest move in its recent multi-month context and overlays the median historical seasonal path for the next 60 days.
What should traders watch in this Microsoft (MSFT) seasonal window?
First, the calendar. The 88-day window opens on Sep 5 and runs through Dec 1, overlapping Microsoft’s next earnings report, currently expected on Oct 28, which has often been a key inflection point for Azure and AI commentary.[5] How the stock trades into and out of that event relative to the historical midterm-year pattern will be an important tell for whether this cycle rhymes with the past.
Second, levels. With Microsoft about 6.7% below its 52-week high, traders will be watching whether the stock can push back toward that 546 area during the early part of the window or whether any pullback resembles prior years where intraperiod drawdowns reached 10% to 15% before recovering. A move that respects those historical downside ranges while still finishing the window higher would be consistent with the long-term seasonal trend.
Third, macro and policy signals. As the midterm election year concludes and the pre-election year approaches, any shift in rate expectations, regulatory tone on big tech, or fiscal policy rhetoric could influence how comfortable investors feel leaning into a historically strong Microsoft seasonal window.[2][7] A friendlier backdrop has often coincided with the better historical outcomes in this pattern, while policy or macro shocks have tended to show up as the deeper MAE episodes inside otherwise winning years.
Finally, watch the AI and cloud narrative. If upcoming commentary reinforces the idea that Azure growth, AI workloads and large commercial backlogs can support both high capex and healthy returns, the seasonal tailwind has historically had more room to express itself.[2][5][7] If, instead, guidance or macro data hint at a slower demand environment or pressure on hyperscaler spending, any break from the nine-for-nine record in this window would send a strong signal that the current cycle is diverging from the past.
Sources
- Seeking Alpha - Microsoft Corporation (MSFT) Stock Price, Quote, News & Analysis
- Yahoo Finance - Why Two Major Analysts Are Pumping The Brakes On Microsoft Before Earnings
- Yahoo Finance - Microsoft Corp. (MSFT) Price Target Increased to $525 by Benchmark
- Yahoo Finance - Is Microsoft (MSFT) One of the Best AI Stocks to Buy in June?
- Public.com - Microsoft (MSFT) Earnings: Latest Report, Earnings Call & Financials
- MarketWatch - Microsoft Corp. Stock Quote (U.S.: Nasdaq) - MSFT
- Yahoo Finance - Over 60 Analysts Say Buy Microsoft. Here’s Our Price Target
- Barchart - Why Microsoft’s Misfires Could Create a Contrarian Opportunity in MSFT Stock
About this seasonal analysis
Seasonal pattern data is sourced from TradeWave.ai, which analyzes historical price behavior across annual calendar windows going back up to 30 years. Read the full data methodology or the book The 100-Year Pattern by Afshin Moshrefi (2026 edition). Past performance of seasonal patterns does not guarantee future results. This article is for informational purposes only and does not constitute investment advice.