Nvidia (NVDA) Has Dropped in 5 of 6 Sep 23-Oct 9 Midterm Windows, Averaging 5% Downside
Nvidia is easing off record levels just weeks before a late-September window that has often brought short-term downside for the AI leader, creating a potential volatility pocket for traders.
Price as of Sep 1, 2026: $217.44 (last close).

What is the seasonal pattern for Nvidia (NVDA)?
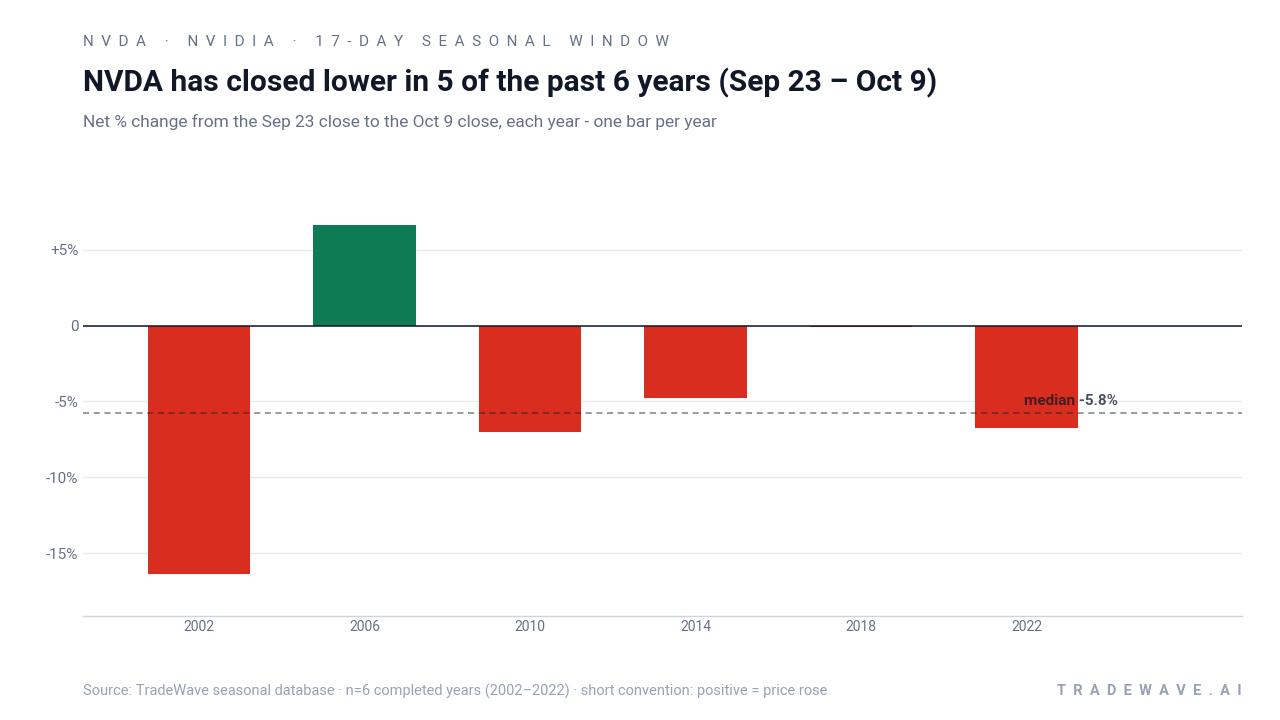
Nvidia has fallen in 5 of 6 midterm-year late-September windows during this 17-day stretch, with average gains of 6.99% in the single winning year.
- 5 of 6 years in this Sep 23 to Oct 9 window have finished lower for NVDA, with a short-side Percent Profitable of 83% (5 winners, 1 loser).
- The trade direction is short, with winning years averaging a 6.99% move in the trade direction, while including all years brings the average outcome to 5%.
- This 17-day Nvidia trading window is drawn from the last 6 midterm election years, a phase that often behaves differently from normal calendar seasonality.
- Individual years have seen sizable swings, with maximum favorable moves above 9% in several cycles and adverse excursions that have stretched beyond 10% in weaker setups.
- Cumulatively, stacking this specific late-September window across the sample adds up to roughly 30% in total return in the trade direction.
- The pattern points to a historically weak, high-variance pocket for Nvidia just as the market transitions from the midterm election year into the stronger pre-election phase.
According to historical data from TradeWave.ai, Nvidia’s late-September behavior in midterm election years has formed a distinct short-term pattern that differs from its typical growth-stock profile.
How has Nvidia (NVDA) traded in the late-September midterm-year window?
Nvidia has closed lower in 5 of the past 6 midterm election years during the Sep 23 to Oct 9 window, a short-biased stretch that has quietly added up to a 30% cumulative gain for traders positioned with the trend. Today the stock finished at 217.44, down 1.5% on the session and about 7.9% below its 52-week high of roughly 235.99, leaving it elevated but off the top of its recent range.
Grouping the data by presidential election cycle matters here because this window captures the final weeks of the midterm election year, just before markets transition into the pre-election year that has historically been friendlier to risk assets. In that late-midterm pocket, Nvidia’s historical seasonality has leaned toward short-term weakness even when the broader AI and semiconductor narrative stayed bullish.
Across the six midterm election years in the sample, the short-side Percent Profitable is 83%, with 5 winning years for shorts and just 1 losing year. The average gain in winning years is 6.99%, while including all years, winners and losers together, brings the average outcome to 5% in the trade direction. That gap between Avg Profit and Avg Profit - All reflects one losing year that clipped returns but did not erase the broader pattern.
The per-year table shows the strongest short-side year was 2002, when Nvidia dropped 16.37% from the Sep 23 close to the Oct 9 close, while the weakest outcome for shorts came in 2006, when the stock rallied 6.62% against the pattern. In 2018 the net move was essentially flat at -0.06%, but intraperiod swings were still meaningful, with a best run-up of 10.19% and a modest 2.11% drawdown from entry. That mix of outcomes is why the window reads as both directionally bearish and volatile.
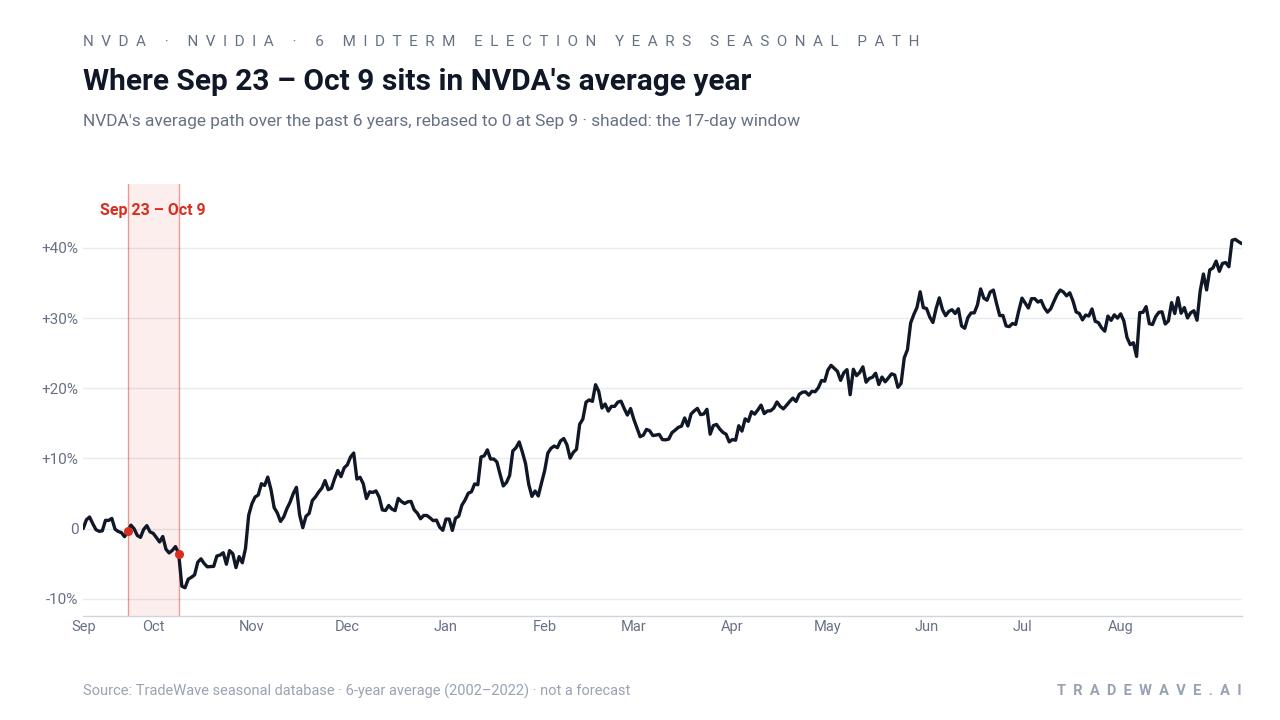
The historical seasonal average suggests Nvidia often stalls or rolls over into this late-September pocket after strength earlier in the month. The shaded 17-day window tends to capture that inflection, with the average path drifting lower rather than trending higher, which aligns with the short-side bias in the stats.
A closer look at yearly ranges shows how far Nvidia has tended to travel in both directions inside this window.
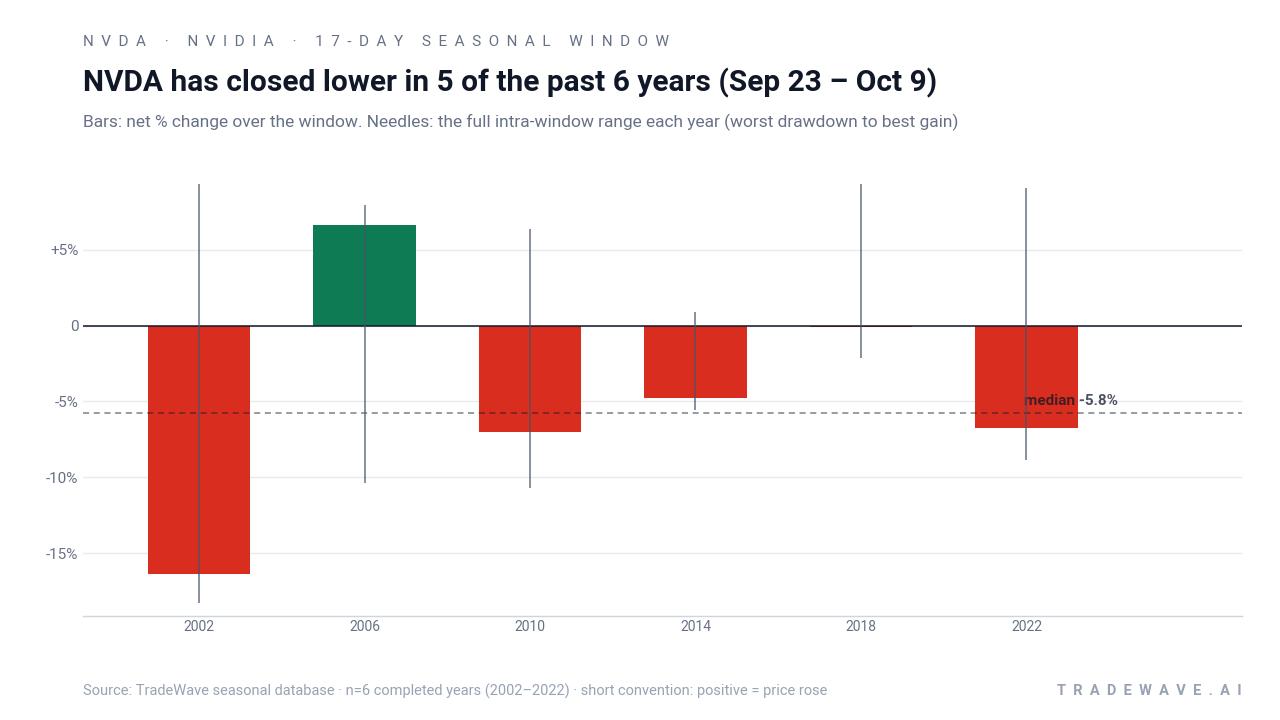
The combined net/MFE/MAE view highlights that even in years where the short trade worked, Nvidia often saw sharp countertrend rallies before rolling over. Maximum favorable moves in the trade direction have pushed into the high single digits, while maximum adverse excursions have also reached double digits in some years, underscoring that this is a high-variance stretch rather than a gentle drift lower.
History does not guarantee future results; adverse excursions can be large even in winning windows, and traders can face significant drawdowns before any seasonal tendency asserts itself.
Why does Nvidia (NVDA) follow this seasonal pattern?
One likely driver is the way the midterm election year clusters macro and policy uncertainty into late September, just as institutional investors rebalance around quarter-end. For a systemically important AI and semiconductor name like Nvidia, that can translate into profit-taking after strong runs, especially when positioning is crowded. The pattern may also reflect options expiration dynamics and risk management around earnings seasons that often sit nearby on the calendar.
What is driving Nvidia (NVDA) today?
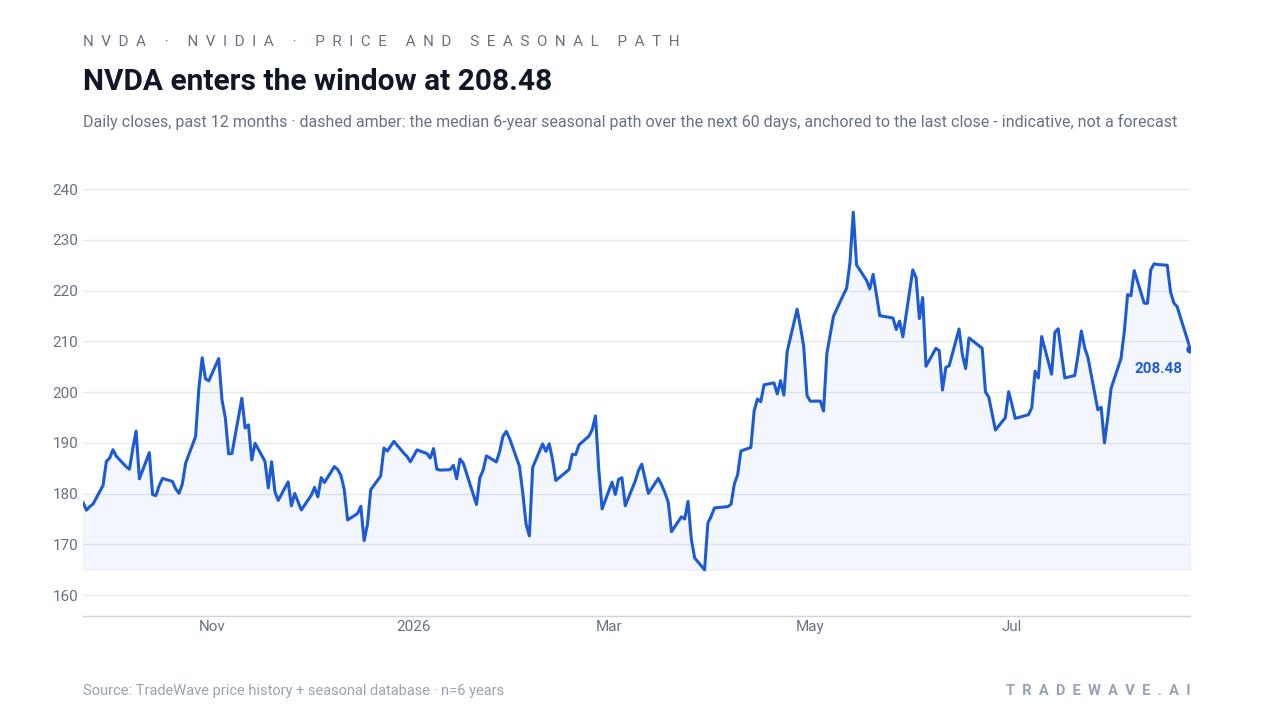
Nvidia slipped 1.5% to 217.44 on Wednesday, trading in a 215.10 to 220.41 intraday band as volume ran slightly below its 20-day average of about 127.7 million shares. The stock remains above its 50-day moving average near 208.62, keeping the broader uptrend from this summer intact even as short-term momentum cools.
In May 2026, Nvidia reported record Q1 fiscal 2027 revenue of $81.6 billion, powered by surging demand for data center compute and networking tied to AI workloads, and delivered materially higher earnings versus the prior year and prior quarter.[1] In November 2025, the company had already flagged this trajectory with Q3 fiscal 2026 revenue of $57.0 billion and GAAP gross margin around 73.4%, underscoring its role as the core infrastructure supplier for generative AI and cloud GPUs.[2] Those results cemented Nvidia’s status as the key swing factor for both the semiconductor sector and broader equity indices, which is why any seasonal volatility in NVDA can ripple through the market.
Corporate actions have reinforced that leadership. In the first nine months of fiscal 2026, Nvidia returned $37.0 billion to shareholders via buybacks and dividends, with $62.2 billion still authorized for repurchases as of the end of Q3 fiscal 2026, signaling management’s confidence in long-term cash generation even as the stock has re-rated higher.[2] More recently, a Reuters report on Aug 27, 2026, said Nvidia agreed to buy AI platform Hugging Face for about $12.9 billion, a move that would deepen its software and model ecosystem and potentially lock in more demand for its chips over time.[3]
The chart below situates the latest pullback against Nvidia’s past year of trading and a historical seasonal projection for the next two months.
What should traders watch as this Nvidia (NVDA) window approaches?
First, the calendar: the 17-day window runs from Sep 23 to Oct 9, squarely in the final stretch of the midterm election year and just ahead of the historically stronger pre-election year. If Nvidia continues to hover near the upper end of its 12-month range into that date, the contrast between elevated price and a historically weak seasonal pocket will be sharper.
Second, levels and volatility: traders will be watching how NVDA behaves around its 50-day moving average near 208.62 and the recent high near 236. A decisive break below the moving average during the window would be consistent with the historical short bias, while a squeeze to fresh highs that holds through Oct 9 would mark a clear deviation from the pattern.
Third, macro and policy catalysts: any shifts in rate expectations, fiscal headlines tied to the midterm political backdrop, or regulatory noise around AI could amplify moves in this already volatile stretch. Because Nvidia is a heavyweight in AI infrastructure and a major component of key indices, outsized swings in this 17-day window have previously coincided with choppier trading in broader tech and growth benchmarks.[1][2]
Finally, corporate positioning: follow-through on the Hugging Face acquisition and any updated commentary on AI demand or capital returns will shape how investors interpret dips or rallies inside the window.[3] If buyback activity remains strong and AI order books stay firm, traders may treat seasonal weakness as a shakeout rather than a trend change; if those supports fade, a historically soft window could become a more meaningful test of Nvidia’s leadership role.
Sources
- NVIDIA Corporation (Investor Relations) - NVIDIA Announces Financial Results for First Quarter Fiscal 2027
- NVIDIA Corporation (Investor Relations) - NVIDIA Announces Financial Results for Third Quarter Fiscal 2026
- Reuters - Nvidia agrees to buy Hugging Face for $12.9 billion, The Information reports
About this seasonal analysis
Seasonal pattern data is sourced from TradeWave.ai, which analyzes historical price behavior across annual calendar windows going back up to 30 years. Read the full data methodology or the book The 100-Year Pattern by Afshin Moshrefi (2026 edition). Past performance of seasonal patterns does not guarantee future results. This article is for informational purposes only and does not constitute investment advice.