Oracle Corporation (ORCL) Has Rallied in 9 Straight Midterm Windows, Averaging 22.54% Gains
Oracle Corporation is about to enter a historically powerful 213-day trading window even as shares sit far below their 52-week peak and options activity has turned unusually aggressive.
Price as of Sep 10, 2026: $152.94 (last close).
What is the seasonal pattern for Oracle Corporation (ORCL)?
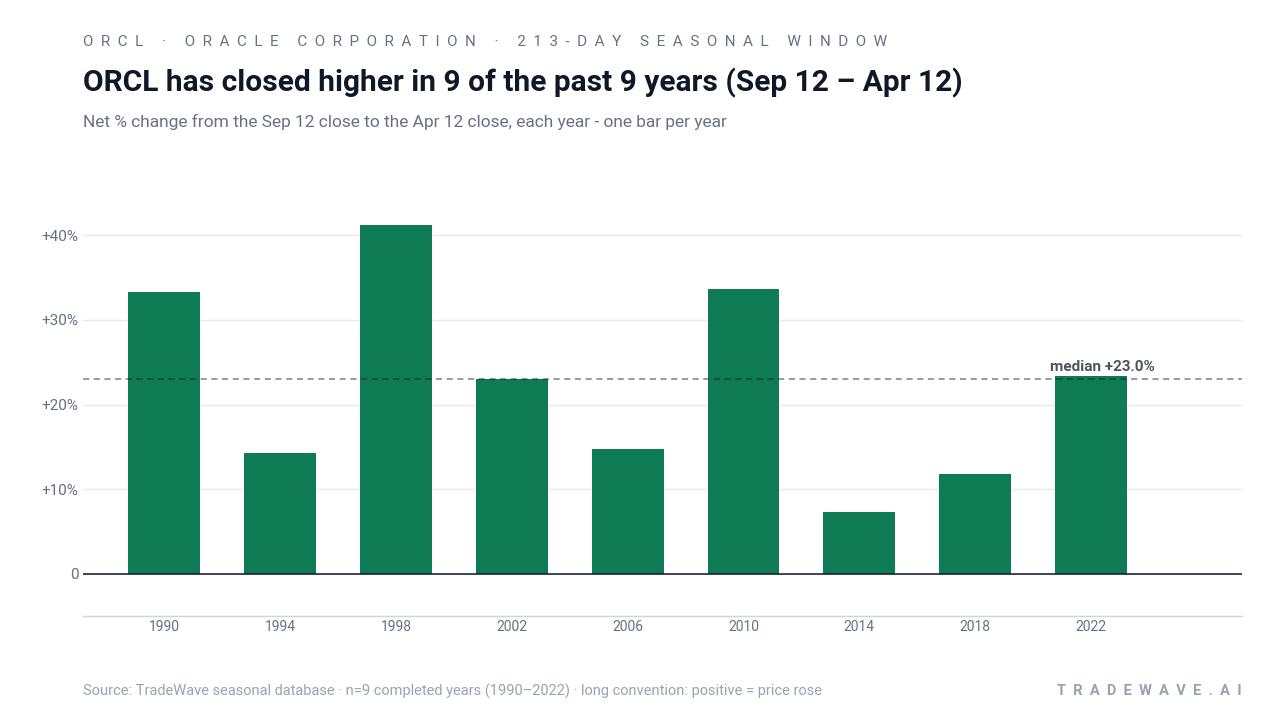
Oracle Corporation has risen in 9 of 9 years during this Sep 12 to Apr 12 midterm-year window, with an average gain of 22.54% in winning years.
- 9 for 9 in this window, with Oracle Corporation averaging 22.54% gains in winning years across the last 9 midterm election cycles.
- Seasonal window runs 213 days from Sep 12 to Apr 12, aligned with the late part of the midterm election year into the following spring.
- Percent Profitable is 100%, with 9 winners and 0 losers in the historical sample.
- Median profit of 23.0% and a Sharpe ratio of 1.75 point to a strong, risk-adjusted upside bias for this long setup.
- TradeWave Ratio of 0.99 indicates that price has typically traveled meaningfully in the trade direction within the window, not just at the close.
- Intraperiod swings have included sizable drawdowns in some years, so the path has not been a straight line even in a perfect win record.
According to historical data from TradeWave.ai, this upcoming stretch for Oracle Corporation has behaved very differently from an average calendar period in prior midterm election years.
How strong is the upcoming seasonal window for Oracle Corporation (ORCL)?
Oracle Corporation has risen in 9 of 9 midterm election years during the Sep 12 to Apr 12 window, averaging 22.54% gains for this long setup. Shares finished the prior session at 152.94, down 5.4% on the day and sitting well below a 52-week high near 338, roughly 54.8% under that peak. Heavy call-option buying and a prior “Power Inflow” alert earlier this year signaled aggressive bullish positioning around the stock, with one report flagging a single session where ORCL traded up about 10.9% on strong order flow and options activity.[5] The combination of a flawless midterm-year seasonal record, a sharp pullback from the highs, and earlier speculative options interest sets up a high-stakes test of whether this pattern can assert itself again as the window opens.
The presidential election cycle matters here because this pattern is built only from midterm election years, a phase that often features policy uncertainty followed by a relief phase as the market looks ahead to the year before the presidential election. In this case, the 213-day Oracle Corporation trading window starts in the late part of the midterm year and runs deep into the following spring, overlapping the historical tendency for risk assets to firm up as Washington gridlock and fiscal plans become clearer.
Historically, the trade direction for this setup is long, and the record is unusually clean: 100% Percent Profitable with 9 winners and 0 losers. Average profit across those years is 22.54%, with a median outcome of 23.0%, which means the typical ORCL seasonal trend in this stretch has been a double-digit gain rather than a marginal drift higher. The annualized return of 22.06% and a Sharpe ratio of 1.75 show that the payoff has not just been large but also strong on a risk-adjusted basis compared with the volatility of outcomes.
Looking at individual years, the strongest midterm-year run came in 1998, when Oracle Corporation gained 41.18% from entry to exit in this window, with a best intraperiod move of 132.47% from the starting level before settling back by the close. The softest outcome was 7.36% in 2014, still positive but much closer to a grind than a surge. Even in that quieter year, the stock’s best move within the window reached 15.69% above the entry before giving some of it back by April.
The intraperiod path has not been painless. In 1990, Oracle Corporation ultimately finished the window up 33.33%, but at one point it was down 40.92% from the entry level before recovering. In 2022, the stock closed the window with a 23.43% gain, yet the worst drawdown from entry during the stretch was 21.15%. That is what the maximum adverse excursion concept captures: the deepest pullback traders would have had to sit through to stay with the seasonal pattern.
On the upside, maximum favorable excursions have often been larger than the final net gains, which is typical for a long seasonal regime that experiences swings along the way. In 2010, for example, Oracle Corporation closed the window up 33.71%, while the best intraperiod run-up reached 37.59% before some retracement. The 2002 window saw a 23.0% net gain with a 40.93% peak move at the best point inside the period, again showing that the ORCL seasonal trend has tended to overshoot and then consolidate.
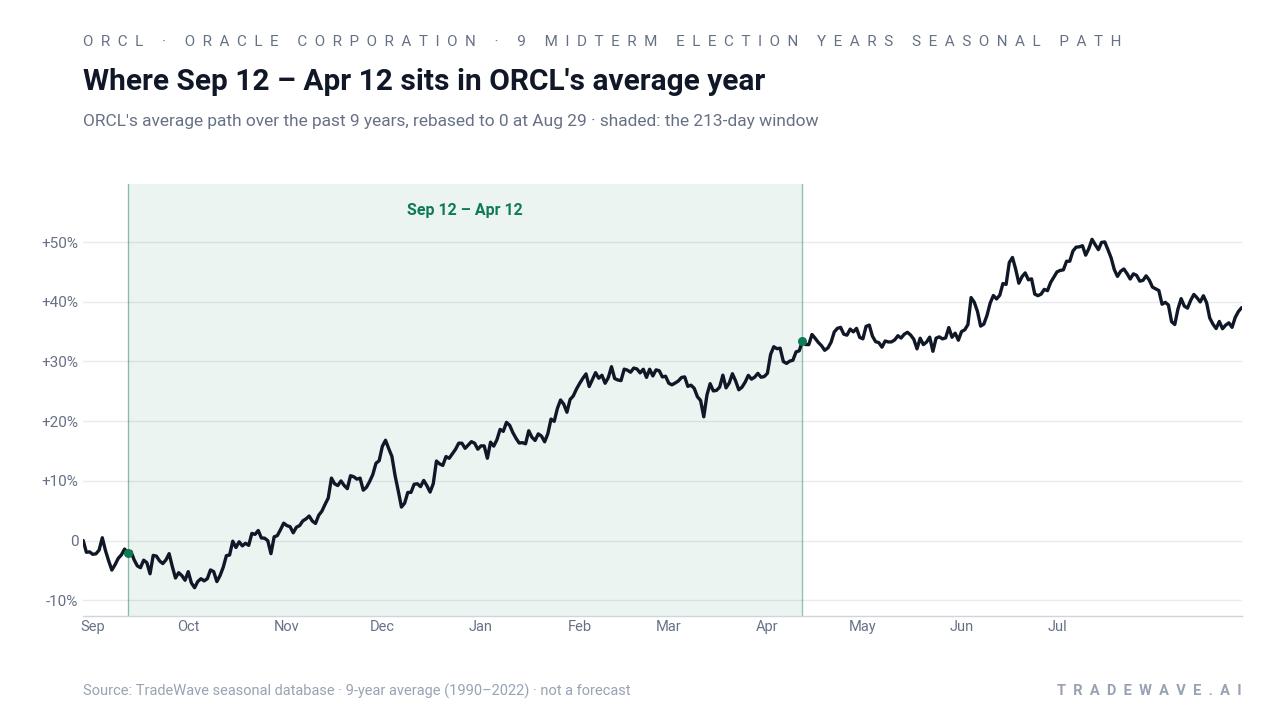
The historical seasonal average chart suggests that Oracle Corporation’s typical pattern in these midterm-year windows is a steady climb rather than a single spike. Gains tend to build as the window progresses, with the path remaining positive on average into the late stages of the period. That fits the idea of a regime shift from late-year uncertainty to a more constructive backdrop as the market transitions into the year before the presidential election.
Yearly net results and intraperiod ranges show how much ORCL has swung inside this window even when the final outcome was positive.
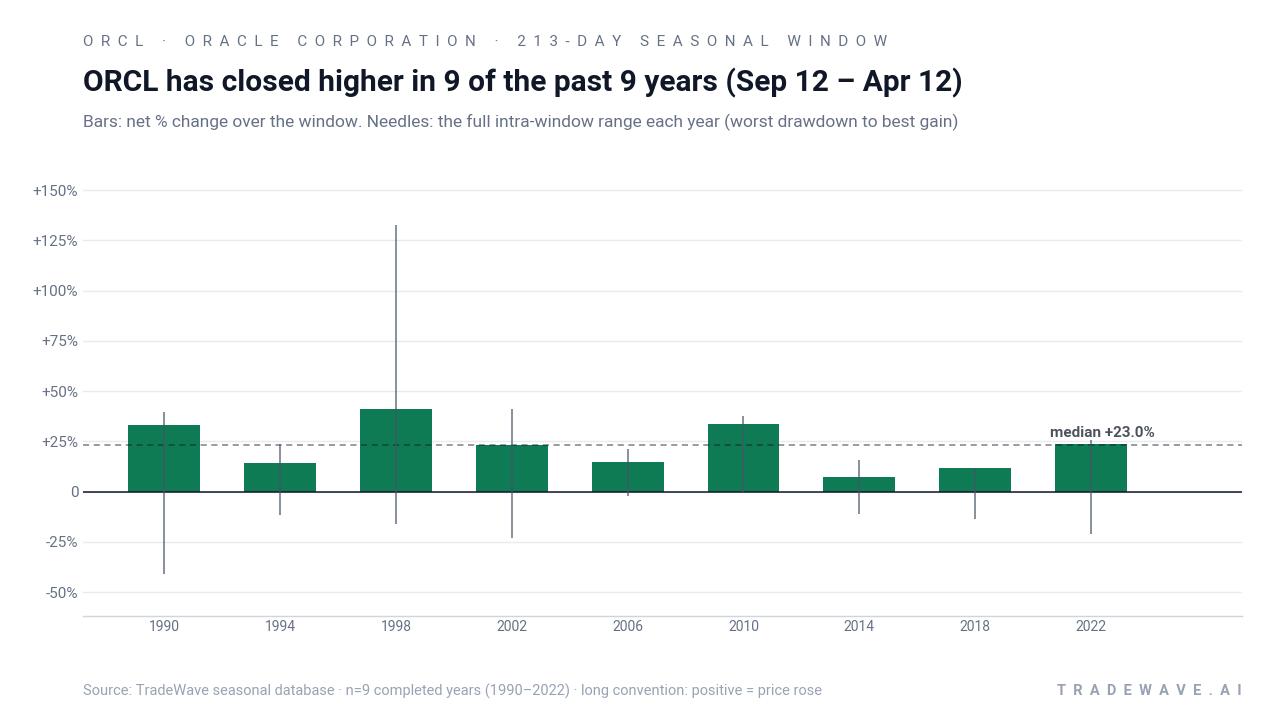
The stacked net, best-move, and worst-drawdown view underlines that this has been a high-conviction long window but not a low-volatility one. Large maximum favorable moves have often come with sizable maximum adverse excursions, especially in years like 1990 and 2002, where Oracle Corporation swung sharply in both directions before finishing higher. Add it up: 501% cumulative gains across the nine completed windows, but with enough downside noise inside each one that position sizing and risk tolerance would have mattered.
History does not guarantee future results, and adverse excursions can be large even in winning windows, so traders should treat this seasonal pattern as context rather than a promise.
Why does Oracle Corporation (ORCL) follow this seasonal pattern?
One likely driver is the way Oracle Corporation’s fiscal calendar and big-ticket enterprise deals line up with the broader presidential election cycle. Analysts have pointed to heavy AI infrastructure spending, large cloud contracts, and budget flushes around year-end and early-year planning as catalysts that can cluster in this stretch for software and cloud providers.[2] This pattern may also reflect institutional portfolio repositioning as investors lean into perceived winners in AI infrastructure and enterprise software heading into the historically stronger year before the presidential election.[3]
What is driving Oracle Corporation (ORCL) today?
Oracle Corporation closed the prior session at 152.94, down 5.4% on the day after a sharp pullback from recent levels, and trading about 54.8% below its 52-week high near 337.97. The stock has been volatile in 2026 as investors weigh heavy AI data-center spending and cloud investments against concerns about software demand and cash burn, with earlier guidance in March lifting fiscal 2027 revenue expectations to $90 billion and sparking a rally at the time.[3] In June 2026, Oracle reported mixed fiscal fourth-quarter results, with software weakness weighing on sentiment even as the AI narrative stayed front and center for the sector.[2] Around late May, MarketBeat highlighted a session where ORCL jumped roughly 10.9% on a bullish “Power Inflow” alert and unusually heavy call-option volume, underscoring how quickly positioning can swing when traders crowd into the name.[5]
The chart below shows how that volatility has played out over the past year alongside a 60-day seasonal projection path.
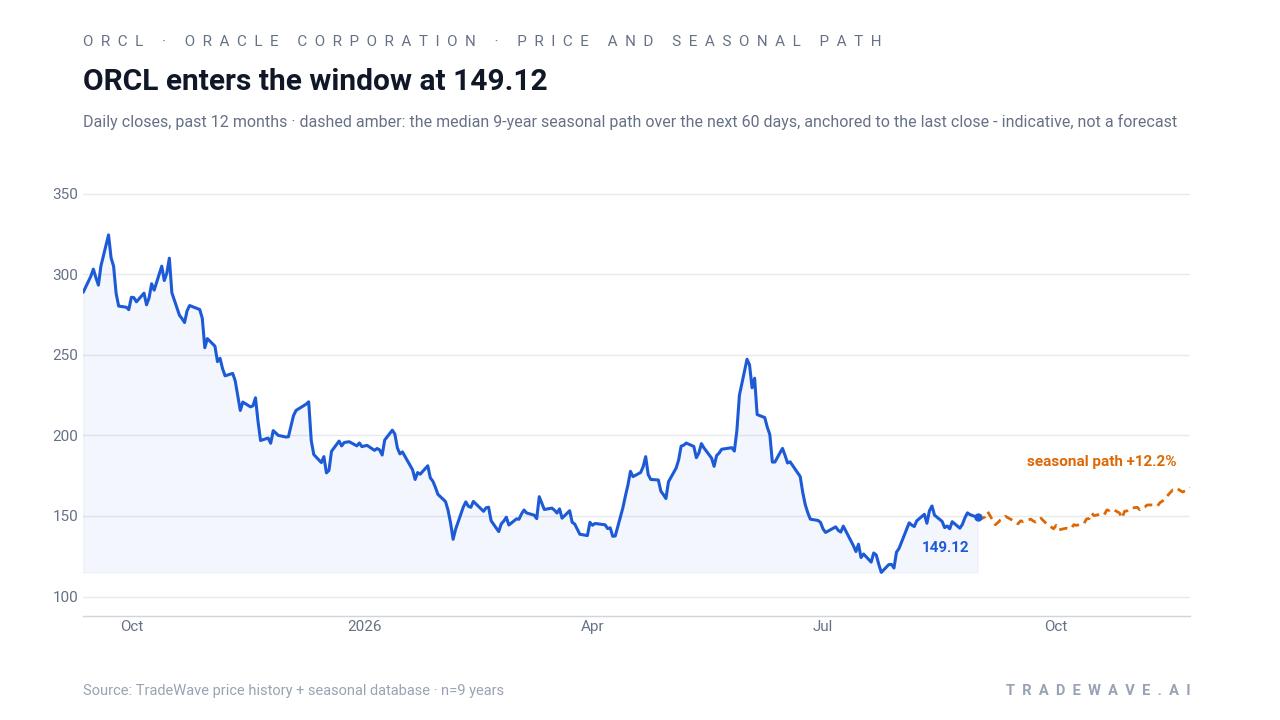
From a macro and sector standpoint, Oracle Corporation sits at the intersection of software, cloud infrastructure, and AI data-center buildout. In March 2026, Reuters reported that the company’s raised revenue forecast eased concerns over its massive AI bets, framing Oracle as a key beneficiary of AI infrastructure spending even as investors scrutinize capital intensity and execution risk.[3] Barron’s coverage of the June quarter noted that software weakness in the results was a negative signal for parts of the software and cloud complex, reinforcing Oracle’s role as a bellwether for enterprise demand.[2] That backdrop means the upcoming seasonal window will not just be about ORCL’s chart pattern; it will also be a live referendum on whether AI-driven growth can offset cyclical and policy headwinds as the market moves from the midterm election year into the year before the presidential election.
What should traders watch in this Oracle Corporation (ORCL) seasonal window?
First, the calendar: the 213-day window that has historically favored longs begins on Sep 12 and runs through Apr 12, spanning the final stretch of the midterm election year and the early months of the year before the presidential election. Traders will be watching how ORCL behaves around key levels inside that window, including whether the stock can stabilize above recent lows and start to retrace some of the gap toward its 52-week high. Second, catalysts: any updates on AI data-center spending, large cloud deals, or fiscal 2027 progress will be critical checkpoints against the historical pattern, especially after earlier guidance and mixed earnings left the narrative finely balanced.[2][3]
Third, options and flow: the earlier “Power Inflow” alert and heavy call-option activity showed how quickly speculative interest can build in Oracle Corporation when the story lines up.[5] During this seasonal window, traders will be watching whether call volumes and bullish order flow re-accelerate on up days or fade as the stock digests prior gains; sustained, broad-based call buying would echo the historical upside bias, while a shift toward put hedging or muted options interest would argue that the crowd is less willing to lean into the pattern. Finally, the big-picture test is whether ORCL’s behavior in this cycle continues the 9-for-9 streak or breaks it: a strong, trending move higher with manageable drawdowns would fit the historical script, while a choppy or negative stretch would signal that the AI and policy backdrop has changed the playbook for this midterm-to-pre-election window.
Sources
- Barchart.com - Ahead of Oracle Earnings, Here's What Barchart Data Says Comes Next for ORCL Stock
- Barron's (Dow Jones) - Oracle Reports Earnings Amid a Rapid Cloud Transformation
- Reuters - Oracle rallies as strong revenue forecast eases concerns over massive AI bets
- MarketWatch (Dow Jones) - Oracle’s stock could surge 80%, says this analyst who predicts a major rebound
- MarketBeat - Oracle (NYSE:ORCL) Trading 10.9% Higher - Here's Why
About this seasonal analysis
Seasonal pattern data is sourced from TradeWave.ai, which analyzes historical price behavior across annual calendar windows going back up to 30 years. Read the full data methodology or the book The 100-Year Pattern by Afshin Moshrefi (2026 edition). Past performance of seasonal patterns does not guarantee future results. This article is for informational purposes only and does not constitute investment advice.