IBM Shares Often Rally in Midterm Windows Starting September 25
IBM is trading well off its 52-week high as it heads toward a long midterm election-year seasonal window that has historically skewed bullish but with sharp drawdowns along the way.
Price as of Aug 25, 2026: $234.19 (last close).

What is the seasonal pattern for IBM (IBM)?
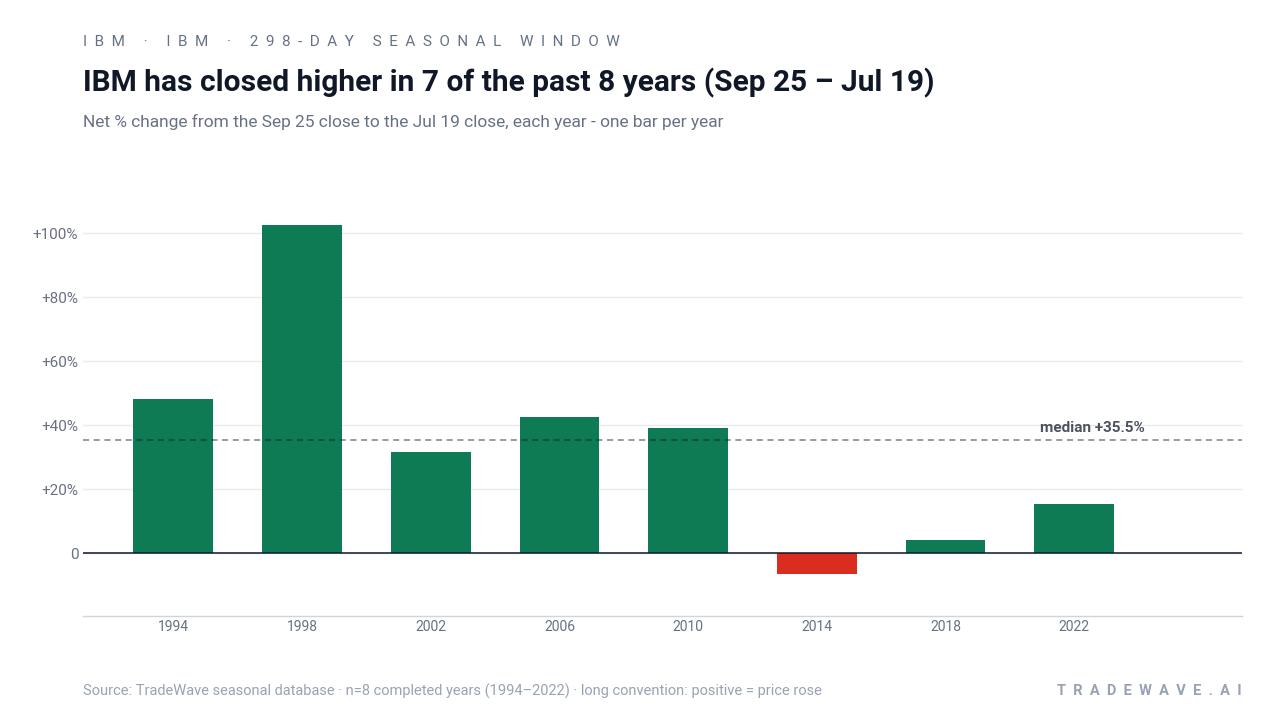
IBM has risen in 7 of 8 years during this Sep 25 to Jul 19 midterm election-year window, with an average gain of 40.55% in winning years.
- 7-for-8 record in this window, with winning years averaging 40.55% gains and a 783% cumulative return when compounded.
- The 298-day trading window runs from Sep 25 through Jul 19 across the last 8 midterm election years, using a long trade direction.
- Percent Profitable is 88%, with 7 winners and 1 loser across the historical sample.
- Avg Profit - All, which includes the single losing year, still comes in at a strong 35% for the full window.
- The weakest year lost 6.38%, but intraperiod drawdowns reached as deep as about 28% even in a year that ultimately finished higher.
- IBM’s seasonal trend in this midterm-to-pre-election stretch has tended to grind higher, but with pockets of sharp volatility that matter for risk management.
According to historical data from TradeWave.ai, this midterm election-year stretch for IBM behaves very differently from an average calendar year, with a distinct long-biased pattern that has repeated across multiple cycles.
How has IBM (IBM) traded in the Sep 25 to Jul 19 midterm window?
IBM has risen in 7 of the last 8 midterm election-year windows that run from Sep 25 to Jul 19, a long seasonal regime that has historically favored the bulls. Shares finished the prior session at 234.19, up 1.4% on the day and about 28.6% below the 52-week high of roughly 327.74, even after an 18.81% gain year to date.[1][2]
The grouping here matters because it lines up IBM’s behavior with the political calendar: the midterm election year through the following pre-election year. That is the stretch when fiscal and regulatory policy often stabilize after early-term resets, and when large-cap tech and software names have historically seen renewed risk appetite as Washington gridlock reduces headline risk for corporate earnings.[6][9]
Across those eight midterm election-year samples, IBM’s Avg Profit of 40.55% in winning years and Avg Profit - All of 35% point to a historically powerful long-biased window. The single losing year, 2014, saw a 6.38% decline from entry to exit, while the strongest year, 1998, delivered a 102.48% gain as the stock more than doubled within the window. Add it up and stacking the window across cycles compounds to a 783% cumulative return, which is unusually strong for a single recurring slice of the calendar.
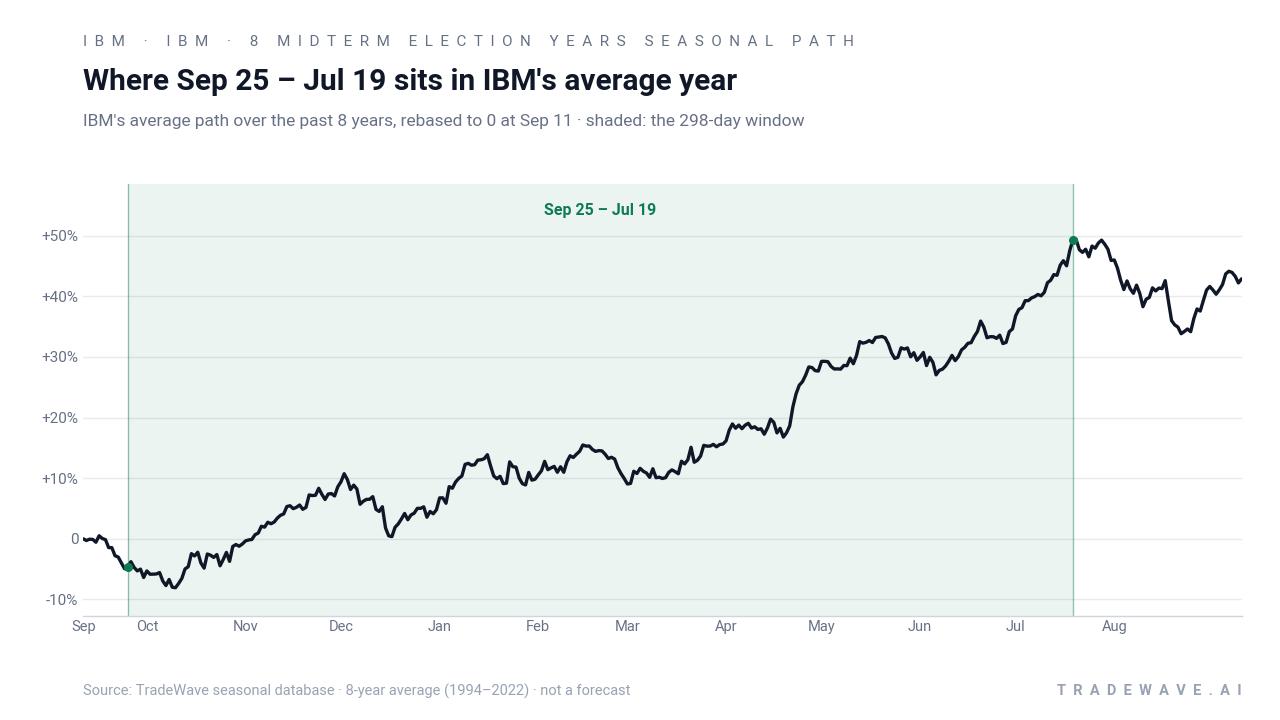
The historical seasonal average suggests that once the window opens in late September, IBM has tended to grind higher through the following summer rather than spike in a single burst. The path is not perfectly smooth, but the average line slopes upward for most of the 298 days, which fits a long trade direction that benefits from time in the market rather than precise timing.
Year-by-year ranges show how much IBM has typically swung inside the window before settling at its final result.
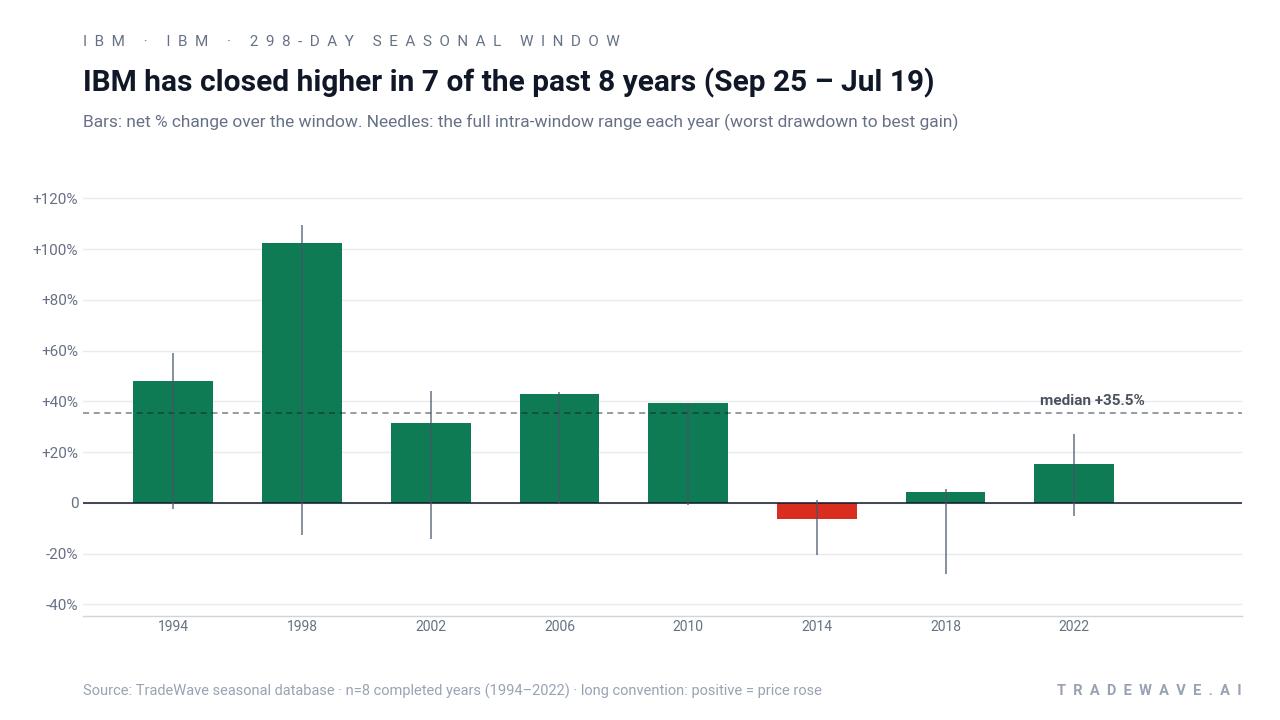
The bar-and-needle profile shows that maximum favorable excursions have often run well ahead of the final net gain, while maximum adverse excursions have at times been deep. In 2018, for example, IBM finished the window up 4.21%, but the worst intraperiod drawdown reached about 27.95% before the stock recovered. That mix of large MFE and sizable MAE fits a high-variance long pattern where patience has historically been rewarded, but only for investors able to sit through sharp swings.
History does not guarantee future results; adverse excursions can be large even in winning windows.
Why does IBM (IBM) follow this seasonal pattern?
One likely driver is the way IBM’s earnings calendar and guidance cadence line up with the political cycle, with key quarters landing as midterm uncertainty fades and pre-election spending and enterprise budgets firm up.[2][6] Analysts have also pointed to sector rotation into established infrastructure and software names during later-cycle risk-on phases, which can favor IBM when investors look for AI and hybrid-cloud exposure without paying peak multiples.[3][10] The pattern may also reflect institutional portfolio rebalancing around fiscal year-ends, when dividend payers and cash-generative tech often see renewed demand.
What is driving IBM (IBM) today?
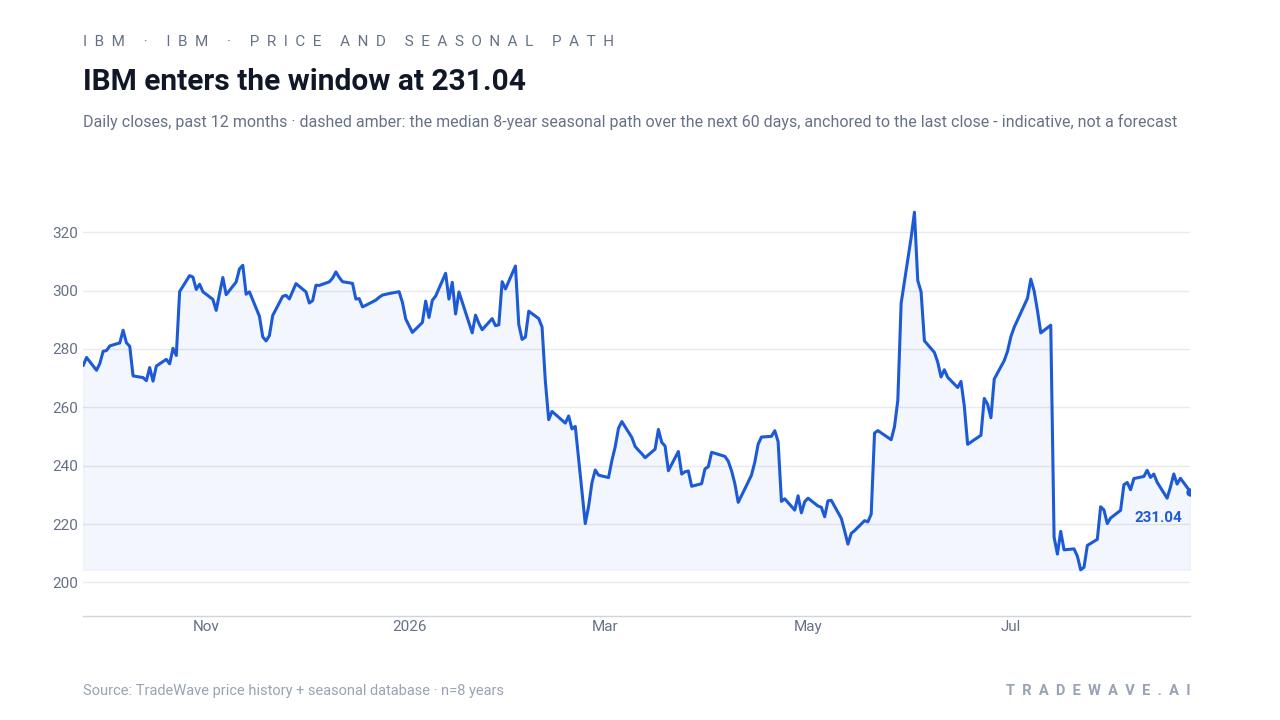
IBM closed the prior session at 234.19, up 3.15 points or 1.4%, leaving the stock roughly 18.81% higher year to date but still about 28.6% below its 52-week high near 327.74.[1][2] That rebound comes after a bruising stretch in July, when IBM issued a second-quarter profit warning and the stock suffered a one-day drop of about 25% as investors digested weaker software and infrastructure demand and scrambled to reprice the AI and quantum story.[6][8][11]
In mid-July, IBM reported Q2 2026 revenue of $17.162 billion and earnings per share of $2.93, missing consensus estimates on both lines and confirming the earlier warning that had already rattled the market.[2][6][11] Coverage from CNBC and others described the move as a historic crash for a stock that many investors had treated as a defensive tech holding, and options strategists quickly highlighted elevated volatility and new ways to trade the name around the dislocation.[8][9][11] Short interest sits around 3.5% according to ChartMill, not extreme by tech standards but enough to matter if sentiment swings again.[2]
Even before the warning, the IBM seasonal trend was intersecting with a bullish narrative around AI infrastructure and quantum computing. In June 2026, analyst notes from Bank of America and Barclays highlighted IBM’s $10 billion quantum commitment, $5 billion earmarked for AI-linked open-source software, and a view that the company’s infrastructure software stack could be a durable beneficiary of enterprise AI spending.[3][10] A July 2026 piece from 24/7 Wall St. via Yahoo Finance pointed to a supportive dividend profile and a cluster of raised price targets, with ChartMill and Yahoo Finance data showing average analyst targets in the mid-$240s, only modestly above where the stock trades after the selloff.[1][2][6]
That leaves IBM in an unusual spot heading into the late-September seasonal window: the stock is still digesting a rare profit shock, but the broader macro backdrop for AI infrastructure demand remains constructive, and consensus ratings sit in Buy territory.[1][2][3] For traders focused on IBM’s seasonal pattern analysis, the key question is whether the midterm election-year window that has historically rewarded long exposure can reassert itself against a backdrop of shaken confidence and elevated realized volatility.
The chart below situates the latest move and the July shock against IBM’s recent 12-month path and the indicative 60-day seasonal projection.
What should traders watch as IBM approaches this seasonal window?
First, the calendar: the 298-day IBM trading window tied to the midterm election year opens on Sep 25 and runs through Jul 19, overlapping the broader midterm-to-pre-election regime that has historically been one of the strongest stretches for U.S. equities in Afshin Moshrefi’s 100-year pattern work.[2] The next major company-specific catalyst is IBM’s scheduled earnings report on Oct 21, which lands early in the window and will test whether July’s warning was a one-off reset or the start of a slower growth phase.[2][6][11]
Second, levels: on the downside, traders will be watching how IBM behaves if it revisits the post-warning lows, especially given the history of intraperiod drawdowns as deep as roughly 20% to 28% inside otherwise winning seasonal years. On the upside, any sustained push back toward the 50-day moving average around 243.72 and then the low-$260s would signal that dip buyers are leaning into the historical seasonality rather than fading it.[1][2]
Third, behavior inside the window: if IBM follows its historical seasonal trend, the stock would tend to grind higher through the first half of 2027 with intermittent volatility rather than a straight-line move. A pattern of higher lows after earnings, coupled with improving breadth in tech and software, would be consistent with the 7-of-8 win record. A failure to hold rebounds, or another guidance shock, would be a clear break from the historical IBM trading window profile and would argue that fundamentals are overwhelming the usual midterm election-year tailwind.[2][6][9]
Finally, options and volume: July’s “historic crash” came with intense options activity and heavy turnover, and any repeat of that kind of flow as the window opens would tell traders that positioning is still fragile.[8][11] If volatility and options interest fade while the stock stabilizes or grinds higher, it would look more like prior strong seasonal years where IBM’s historical seasonality quietly did its work in the background.
Sources
- Yahoo Finance (New Zealand) - International Business Machines Corporation (IBM) stock price, news, quote and history - Yahoo Finance
- ChartMill - IBM Stock Price, Quote & Chart
- Yahoo Finance - Analyst Lifts IBM Price Target by $15. Here is Why
- Barchart - Wedbush Just Increased Its Price Target on IBM Stock. The Company Is Quietly Building a New Chapter.
- Yahoo Finance - Why IBM (IBM) Stock Is Up Today
- 24/7 Wall St. via Yahoo Finance - The Big Reason IBM Is a Great Buy Before July 22 Earnings
- Yahoo Finance - IBM (IBM) Stock Slides as Market Rises: Facts to Know Before You Trade
- CNBC - Historic IBM stock crash sets up unique options strategy
- Wall Street Journal - The Inside Story of IBM’s Shocking Profit Warning - WSJ
- Business Insider - IBM Stock Shoots Higher After Bullish Barclays Forecast - Business Insider
- CNBC - IBM stock craters after company issues second-quarter ...
About this seasonal analysis
Seasonal pattern data is sourced from TradeWave.ai, which analyzes historical price behavior across annual calendar windows going back up to 30 years. Read the full data methodology or the book The 100-Year Pattern by Afshin Moshrefi (2026 edition). Past performance of seasonal patterns does not guarantee future results. This article is for informational purposes only and does not constitute investment advice.