Walmart (WMT) Has Risen 10 of 10 Years in This 199-Day Fall-to-Spring Rally Window
Walmart shares sit well below their 52-week peak as the stock approaches a 199-day fall-to-spring window that has quietly delivered gains every year for the past decade.
Price as of Sep 15, 2026: $108.09 (last close).

What is the seasonal pattern for Walmart (WMT)?
Walmart has risen in 10 of 10 years during this Sep 29 to Apr 15 window, with an average gain of 11.75% in winning years.
- 10 for 10 in this window, with Walmart averaging 11.75% gains across all winning years over the past decade.
- The upcoming seasonal stretch runs roughly from Sep 29 through Apr 15, spanning 199 calendar days in the historical sample.
- Percent Profitable sits at 100%, with 10 winners and 0 losers in the Trade Direction long pattern.
- Average annualized return in the window is 11.63%, with a Sharpe ratio of 1.8 and a TradeWave Ratio of 1.49.
- Individual years have seen net gains ranging from about 3.0% to 21.53%, with some sizable intraperiod drawdowns before finishing higher.
- Stacking this Walmart seasonal window year after year would have compounded to roughly 200% cumulative return across the 2016–2025 sample.
According to historical data from TradeWave.ai, this long fall-to-spring stretch has behaved very differently from an average calendar period for Walmart. The next section walks through what that pattern has looked like and how it lines up with today’s setup.
How has Walmart (WMT) traded in the Sep 29 to Apr 15 seasonal window?
Walmart has closed higher in every single Sep 29 to Apr 15 window for the past 10 years, averaging 11.75% gains with a long trade direction. At Wednesday’s close of 108.09, the stock sits about 19.7% below its 52-week high of 134.52 and roughly 11.1% above its 52-week low of 97.24, leaving plenty of room on both sides of the recent range.
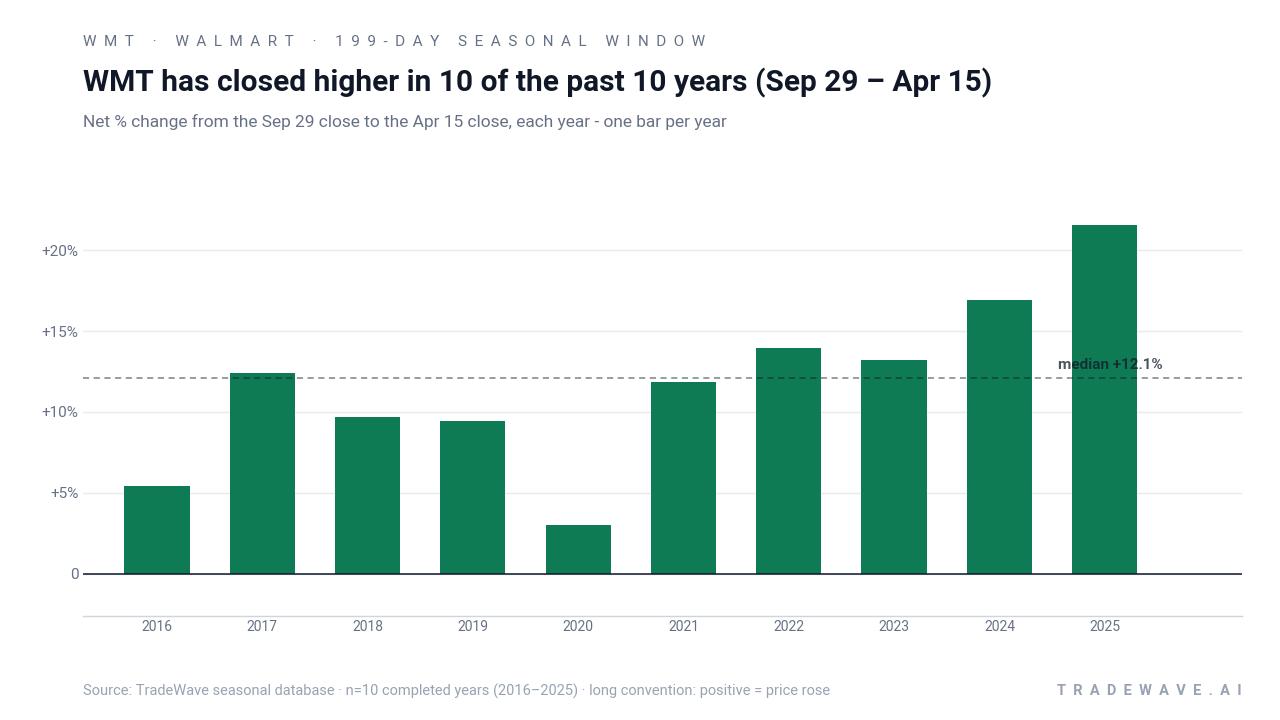
Across the 2016–2025 sample, the strongest year in this Walmart trading window was 2025, when the stock gained 21.53% between the late-September entry and mid-April exit. The softest outcome was 2020, which still finished up 3.0% despite a choppy path. Median profit of 12.13% sits close to the average, which suggests the wins have been relatively clustered rather than driven by a single outlier year.
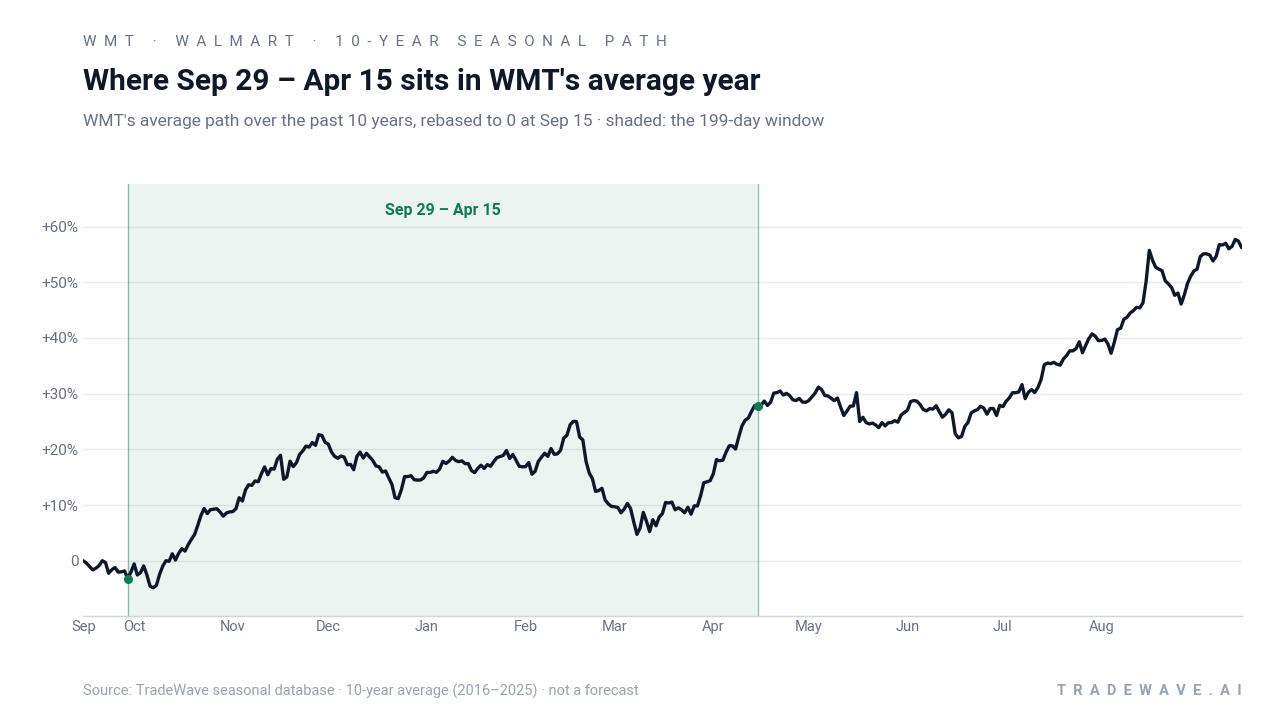
The historical seasonal trend chart for this window shows Walmart’s average path grinding higher through the fall, pausing around the holidays, then adding another leg of gains into early spring. That shape lines up with the company’s core calendar, where back-to-school, holiday, and early-year grocery traffic all matter for the Consumer Defensive seasonal outlook.
A second view stacks net returns with the full intraperiod range to show how far the stock has swung inside each window.
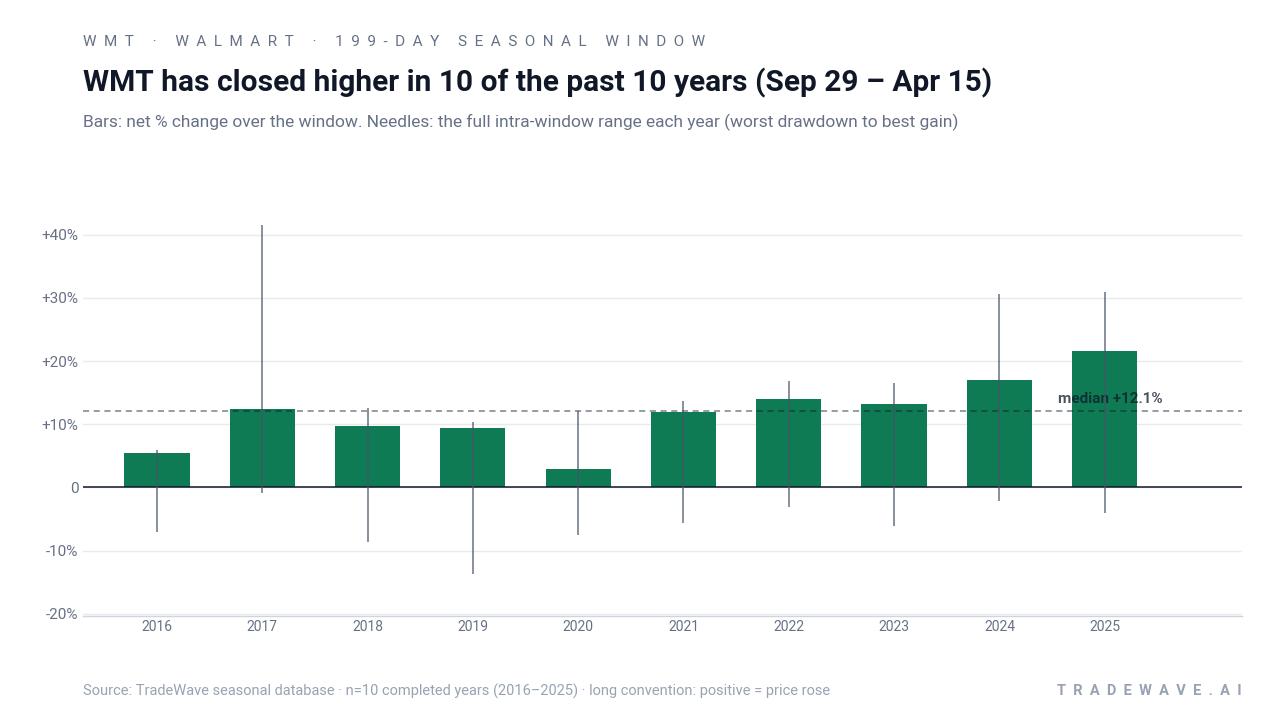
The maximum favorable move, or best run-up from entry inside the window, has often been much larger than the final net gain, with several years posting intra-window rallies above 30%. At the same time, the maximum adverse move, or worst drawdown from entry, has reached between roughly 3% and 14% in different years, reminding traders that even a strong WMT seasonal trend has come with meaningful downside swings along the way.
History does not guarantee future results; adverse excursions (MAE) can be large even in winning windows.
Why does Walmart (WMT) follow this seasonal pattern?
One likely driver is the clustering of Walmart’s biggest demand periods, from back-to-school through the holidays and into early-year grocery and essentials spending. Analysts have also pointed to institutional portfolio repositioning around the company’s late-year and early-year earnings reports, which can favor a defensive retail name when macro uncertainty is high.[1][3] The pattern may also reflect sector rotation, as investors lean into Consumer Defensive stocks during the winter when growth visibility and consumer budgets are under more scrutiny.
What is driving Walmart (WMT) today?
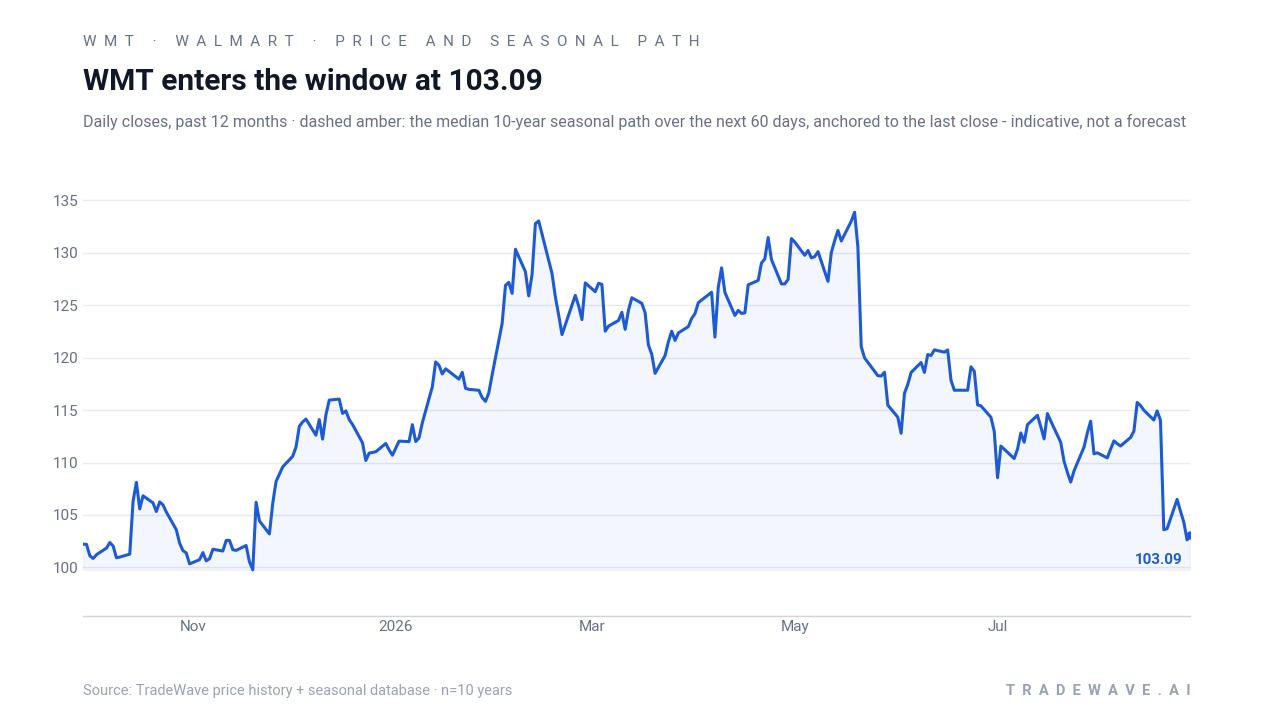
Walmart closed Wednesday at 108.09, down 0.91% on the day, leaving the stock about 19.7% below its 52-week high of 134.52 and roughly 11.1% above its 52-week low of 97.24. That puts the world’s largest retailer in the middle of its one-year range as investors look past the last reported quarter and toward the next update on consumer demand.
In February 2026, Walmart reported a strong holiday quarter with revenue of $190.7 billion, up 5.6% from the prior year, and adjusted EPS that edged past Wall Street estimates, but a conservative full-year outlook initially weighed on the stock.[1][3] The company guided for sales growth of 3.5% to 4.5% in the current quarter and full-year sales of about $706.4 billion, with EPS around $2.64, framing expectations for steady but not explosive growth.[1] In January 2026, MarketBeat data showed a “Moderate Buy” consensus rating on Walmart and a consensus price target of $131.88, reflecting a constructive but not euphoric Street stance at that time.[5]
Sector-wise, Walmart sits in the Consumer Defensive / Retail defensive bucket and has been gaining share across income cohorts as shoppers trade down and hunt for value.[4] The company has leaned into that role by cutting prices on thousands of items to capture cost-conscious consumers, even as higher fuel costs and price investments have pressured margins.[1][3] That mix of steady traffic, price sensitivity, and cautious guidance helps explain why the stock is well off its highs heading into a historically strong seasonal window.
Ownership and positioning have also been in focus. A MarketBeat alert on Sep 14, 2026 highlighted a large position in Walmart shares held by Bank of America Corp DE, underscoring the stock’s importance in institutional portfolios and its role as a bellwether for U.S. consumer health.[7] Earlier commentary from GuruFocus and Walmart’s own 10-K has flagged ongoing insider selling and detailed the company’s insider trading policy, which investors have weighed against the stock’s long-term uptrend.[4][6]
The chart below situates the latest move in its recent multi-month context alongside the median 10-year seasonal path.
What should traders watch as this Walmart seasonal window approaches?
First, the calendar. The next iteration of this 199-day Walmart seasonal window begins on Sep 29, so price action in the back half of September will set the entry level that future performance is measured against. A move closer to the 52-week low before the window opens would give the historical pattern more room to work, while a sharp rally toward the high would compress that cushion.
Second, earnings and guidance. Walmart’s next scheduled earnings date is Feb 19, 2026, which falls inside the historical window and will be a key test of whether conservative guidance gives way to a more upbeat tone on consumer demand and margins.[1][3] Traders will be watching how same-store sales, e-commerce growth, and commentary on price investments line up with the company’s earlier targets for roughly $706.4 billion in annual sales and $2.64 in EPS.[1]
Third, sector and macro signals. Any fresh signs of pressure on lower- and middle-income consumers, from fuel prices to credit delinquencies, could reinforce Walmart’s role as a share gainer in a stretched household budget environment.[3][4] Conversely, a broad risk-on rally that favors higher-beta retail names over defensive giants could blunt some of the historical seasonal tailwind for WMT.
Finally, institutional positioning. The large stake highlighted for Bank of America Corp DE and ongoing insider activity give traders a reason to track ownership disclosures and insider filings as the window opens.[4][6][7] If big holders add to positions while the stock trades well below its 52-week high, that would rhyme with a decade of positive seasonal outcomes; if they step back or selling accelerates into strength, it would be an early sign that this year’s path may diverge from the historical script.
Sources
- Seeking Alpha - Walmart turns lower after profit outlook overshadows solid holiday quarter
- CNBC - Check out Walmart's stock price (WMT) in real time - CNBC
- Associated Press - Walmart delivers another quarter of impressive sales but offers a muted outlook
- GuruFocus - Wal-Mart (WMT) Sees Mixed Signals from Option Traders
- MarketBeat - WMT Stock Near All-Time Highs Despite Insider Selling
- Walmart (SEC Filing) - 10-K: Annual report [Section 13 and 15(d), not S-K Item 405]
- MarketBeat (instant alert) - 65,823,155 Shares in Walmart Inc. $WMT Acquired by Bank of America Corp DE
About this seasonal analysis
Seasonal pattern data is sourced from TradeWave.ai, which analyzes historical price behavior across annual calendar windows going back up to 30 years. Read the full data methodology or the book The 100-Year Pattern by Afshin Moshrefi (2026 edition). Past performance of seasonal patterns does not guarantee future results. This article is for informational purposes only and does not constitute investment advice.