Walmart (WMT) Readies for 199-Day Fall-Spring Run After 10-for-10 Winning Streak
Walmart shares sit well below their 52-week high just weeks before a 199-day fall–spring stretch that has quietly delivered gains every year for the past decade.
Price as of Sep 4, 2026: $107.14 (last close).
What is the seasonal pattern for Walmart (WMT)?
Walmart has risen in 10 of 10 years during this Sep 29 to Apr 15 window, with an average gain of 11.75% in winning years.
- 10 for 10 in this window, with Walmart averaging 11.75% gains across all winning years over the past decade.
- The upcoming seasonal window starts on Sep 29 and runs 199 days through mid-April, covering the core holiday and tax-refund period.
- Percent Profitable is 100%, with 10 winners and 0 losers in the historical sample.
- The TradeWave Ratio of 1.49 signals that price has typically traveled meaningfully in the long direction within the window, not just at the close.
- A Sharpe ratio of 1.8 for this window points to a strong risk-adjusted profile compared with many single-stock seasonal patterns.
- Individual years have still seen drawdowns inside the window, so gains have not come in a straight line even when the final result was positive.
According to historical data from TradeWave.ai, this long fall–spring stretch has behaved very differently from an average month on the calendar for Walmart, and the next iteration is less than a month away.
How has Walmart (WMT) traded in the Sep 29 to Apr 15 window?
Walmart has finished higher in every single Sep 29 to Apr 15 window for the past 10 years, averaging an 11.75% gain across those long trades. The next 199-day window begins on Sep 29, with the stock currently at 107.14, about 20.3% below its 52-week high and roughly 10.2% above its 52-week low. That combination of a clean 10-for-10 record and a pullback from the highs gives this year’s setup a very different feel from chasing a stretched chart into strength.
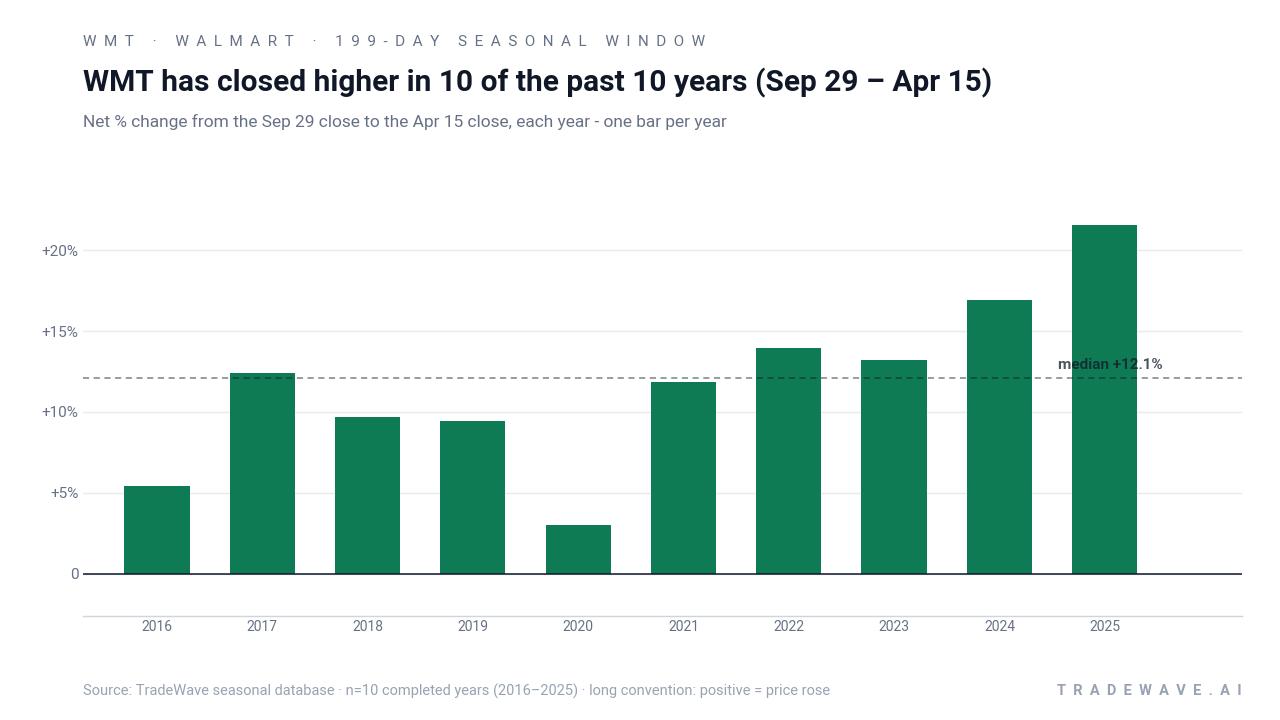
Across the 10-year sample, the strongest year in this Walmart trading window was 2025, when the stock gained 21.53% between late September and mid-April, after reaching a best intraperiod run-up of 30.93% from the entry. The softest outcome was 2020, which still finished up 3.0% despite a maximum favorable move of 12.05% and a worst drawdown of 7.58% from the starting level. That gap between the best intraperiod rally and the final close shows how often traders left money on the table even in winning years.
Looking at the extremes, the maximum favorable move in any year reached 41.49% in 2017, while the deepest intraperiod drawdown was 13.67% in 2019. In plain English, the historical range suggests that when this Walmart seasonal window runs hot, it can deliver multi‑month rallies, but it has also included double‑digit pullbacks along the way. The long trade direction means those big upside spikes were favorable years for the pattern, while the deeper drawdowns marked tougher stretches to sit through even when the final result was positive.
A second view of yearly ranges shows how upside and downside have coexisted inside this otherwise consistent window.
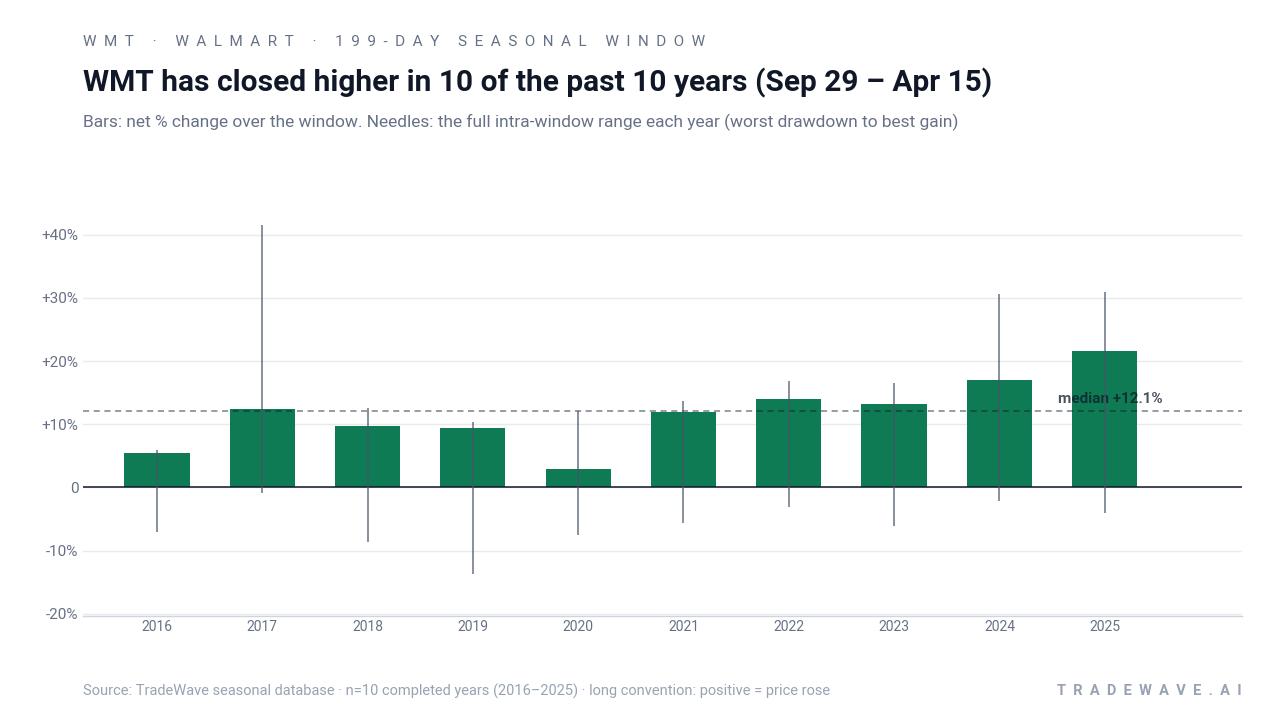
History does not guarantee future results; adverse excursions (MAE) can be large even in winning windows.
Why does Walmart (WMT) follow this seasonal pattern?
One likely driver is the clustering of Walmart’s heaviest demand periods inside this window, from back‑to‑school clearance through the holidays and into tax‑refund season. Analysts often point to consumer spending cycles and institutional portfolio rebalancing around year‑end as key forces that can favor large, defensive retailers during this stretch. The pattern may also reflect sector rotation into staples when macro uncertainty rises, which can support Walmart’s stock even when broader markets chop sideways.
What is driving Walmart (WMT) today?
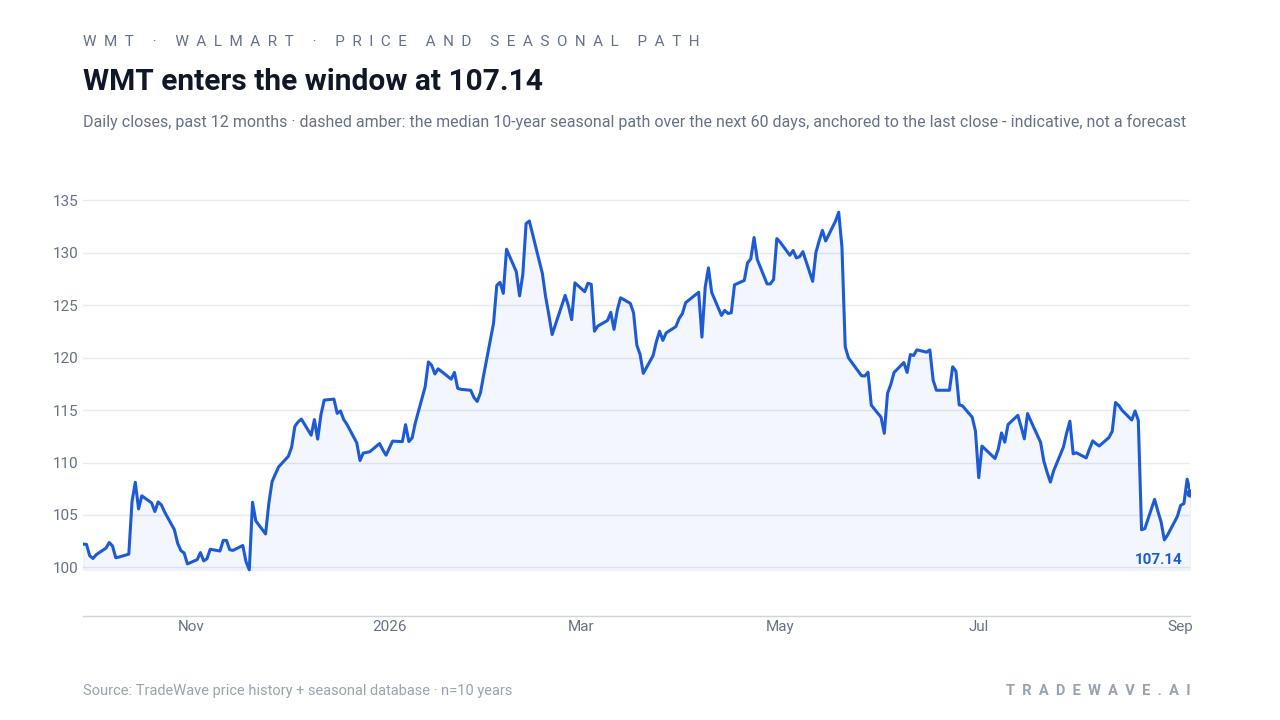
Walmart closed the prior session at 107.14, down 1.18% on the day, leaving the stock about 20.3% below its 52-week high of 134.52 and roughly 10.2% above its 52-week low of 97.24. Trading volume of about 19.1 million shares came in below the recent 20-day average of 27.7 million, and the stock also sits under its 50-day moving average near 110.46, underscoring a modest pullback after a strong multi‑year run.
Regulatory scrutiny has been the main headline driver in early September. On Sep 2, the U.S. Department of Justice’s antitrust division expanded a beef‑pricing probe, sending letters to Walmart and several other major retailers seeking data on meat pricing, a move that could keep pressure on grocery margins if it leads to changes in pricing practices.[2] A day later, Walmart said it was broadening its restaurant delivery business through a collaboration with Inspire Brands, starting with in‑store Dunkin’ locations on its app, a small but telling step in its push to deepen digital engagement and capture more share of consumer food spending.[1]
In its most recent quarter, Walmart reported second‑quarter revenue of $187.9 billion and first‑half inventory of $61.6 billion, underscoring the scale that lets it lean into grocery price competition even as beef and other food categories face inflation pressure.[1] With no confirmed date yet for the next earnings release, investors are using those numbers as the latest checkpoint on how Walmart is balancing traffic growth, price leadership and profitability heading into the holiday season.
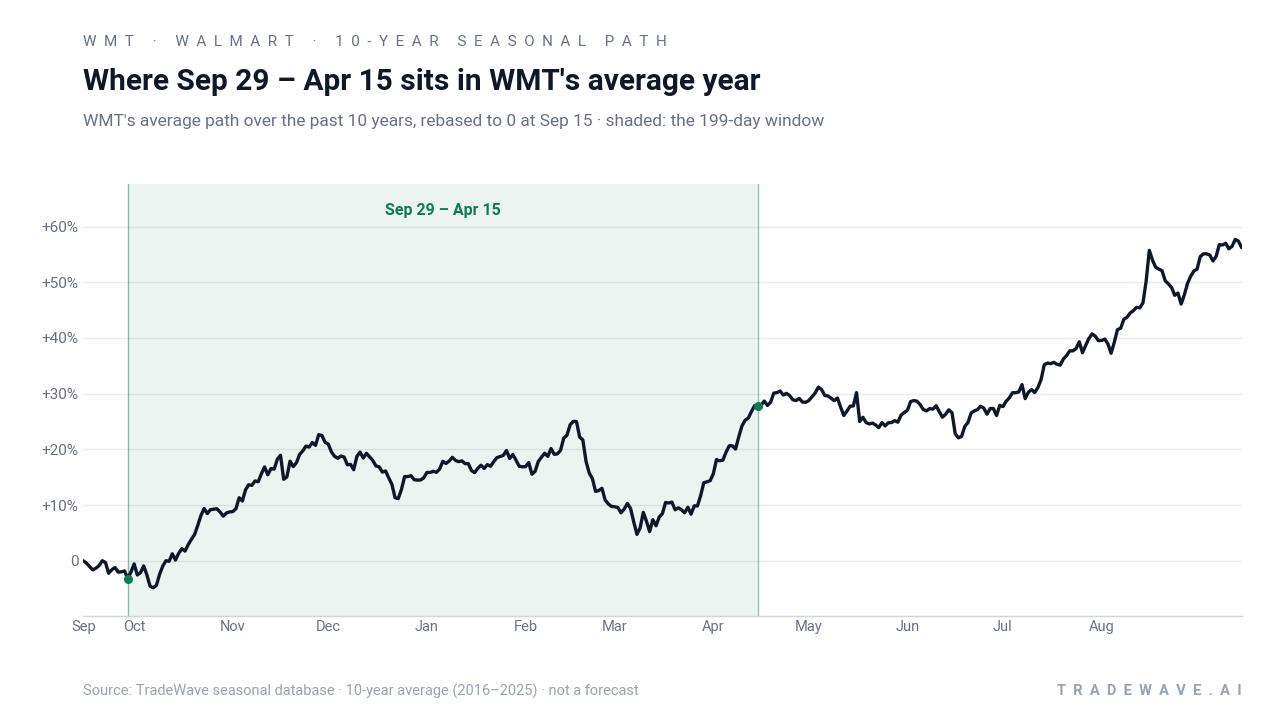
The chart below situates the latest move in its recent multi-month context alongside the median seasonal path for the next 60 days.
How are inflation and grocery competition affecting Walmart (WMT)?
Walmart’s seasonal strength arrives against a backdrop of elevated food inflation and record or near‑record beef prices, which have drawn federal scrutiny and complicated pricing decisions for every major grocer.[2] Ground beef was cited at $7.116 per pound in July in government data referenced by recent coverage, highlighting how far meat prices have climbed and why regulators are probing retailer behavior.
For Walmart, that environment cuts both ways. Higher beef and grocery prices can pressure margins if the company chooses to absorb some of the inflation to protect its “everyday low price” brand, but they can also drive traffic as budget‑conscious shoppers trade down from smaller rivals. Sector commentary has stressed that Walmart’s grocery scale lets it compete aggressively on price with Target, Kroger and Costco, even if that means accepting thinner per‑item profits in the short term.[1]
How are investors valuing Walmart (WMT) into this seasonal window?
Traditional valuation markers such as forward price‑to‑earnings or dividend yield are not detailed in the latest coverage, but the stock’s position relative to its own trading history offers a simple reference point. With Walmart about 20.3% below its 52-week high and trading under its 50-day moving average, the market is no longer pricing it as a momentum staple at the very top of its range. At the same time, the stock remains well above its 52-week low, suggesting investors still see it as a core defensive holding rather than a distressed value play.
Street commentary in recent months has focused less on big multiple expansion and more on Walmart’s ability to sustain steady earnings growth while navigating food inflation, regulatory risk and ongoing investment in e‑commerce and delivery.[1] Against that backdrop, the upcoming seasonal window functions less as a call on multiple re‑rating and more as a historical lens on how the stock has tended to trade while those fundamental debates play out.
What should traders watch as Walmart (WMT) approaches this window?
First, the calendar. The 199-day seasonal window opens on Sep 29 and runs through mid‑April, covering Black Friday, the core holiday season and the early tax‑refund period. Historically, that has been the stretch when Walmart’s stock has quietly done its best work, with 10 straight positive outcomes and a 200% compounded gain if you stacked the window year after year.
Second, price levels. On the downside, the 52-week low near 97.24 is the obvious line in the sand that would mark a clear break from the pattern of buying dips in this name. On the upside, the 50-day moving average around 110.46 and then the 120–125 zone, which roughly corresponds to last year’s exit prices in the seasonal sample, are the areas where traders will look to see whether rallies behave like prior years or stall out earlier.
Third, catalysts. The next earnings report, once scheduled, will land inside this window and will be the key test of how Walmart is managing grocery margins under regulatory scrutiny and food inflation.[1][2] Any update on the Department of Justice beef‑pricing probe, or on the performance of new delivery partnerships like the Inspire Brands collaboration, could also shift sentiment quickly.[1][2]
Finally, behavior versus history. If Walmart grinds higher through the fall with the kind of steady, low‑drama advance seen in many of the past 10 years, that would line up cleanly with the established seasonal trend. A sharp break below the 52-week low or a failure to participate in any broader retail strength during the holidays would be a clear sign that this cycle is diverging from the historical script. For traders who track seasonality, the next few weeks are about watching whether Walmart once again leans into its strongest stretch of the year or writes a different story this time.
Sources
- GuruFocus (via Yahoo Finance) - Walmart Jumps Nearly 2.8% as Justice Department Widens Beef-Pricing Review
- Benzinga (via Yahoo Finance) - Trump's DOJ Expands Beef Price Probe to Walmart, Costco, Amazon and 5 Other Retail Giants — Calls it a 'Critical Concern'
- Barchart - Five July 4th Fireworks: Unusual Options Activity Flags Cheap Lottery-Ticket Calls in CHWY, AVGO, PYPL, STLA and WMT
About this seasonal analysis
Seasonal pattern data is sourced from TradeWave.ai, which analyzes historical price behavior across annual calendar windows going back up to 30 years. Read the full data methodology or the book The 100-Year Pattern by Afshin Moshrefi (2026 edition). Past performance of seasonal patterns does not guarantee future results. This article is for informational purposes only and does not constitute investment advice.