Apple Inc. (AAPL) Has Rallied in 9 of 10 Late-October Midterm Windows, Averaging 7.26% Gains
Apple Inc. is approaching a historically strong late-October trading window just as shares hover near record highs ahead of earnings and sensitive China headlines.
Price as of Sep 24, 2026: $335.92 (last close).

What is the seasonal pattern for Apple Inc. (AAPL)?
Apple Inc. has risen in 9 of 10 midterm-year late-October windows, with an average gain of 7.26% in winning years.
- 9 for 10 in this window, with winning years averaging 7.26% gains across the last 10 midterm election years.
- The upcoming 21-day window runs from Oct 11 to Oct 31 and has historically favored long positions in Apple Inc. shares.
- Percent Profitable stands at 90.0%, with 9 winners and 1 loser across the sample.
- Including every year, Avg Profit - All is 6.53%, showing that the lone losing year has not erased the typical upside.
- Intraperiod swings have been meaningful, with both strong maximum favorable moves and notable drawdowns inside the window before the final result.
- The pattern sits in the concluding midterm election year, just ahead of the historically supportive pre-election phase for large-cap tech.
According to historical data from TradeWave.ai, this specific late-October stretch has behaved very differently from an average month in Apple’s trading year. The next section walks through how that pattern has played out across the last 10 midterm election cycles without making any prediction about what comes next.
How has Apple Inc. (AAPL) traded in the late-October midterm window?
Apple Inc. has risen in 9 of the last 10 midterm election years during the Oct 11 to Oct 31 window, with winning years averaging a 7.26% gain. Today the stock closed at 335.92, leaving it about 2.7% below its 52-week high of 345.34 and up 23.56% year to date. That combination of a strong historical seasonal trend and a stock already near the top of its range gives this upcoming window more weight than a typical calendar quirk.
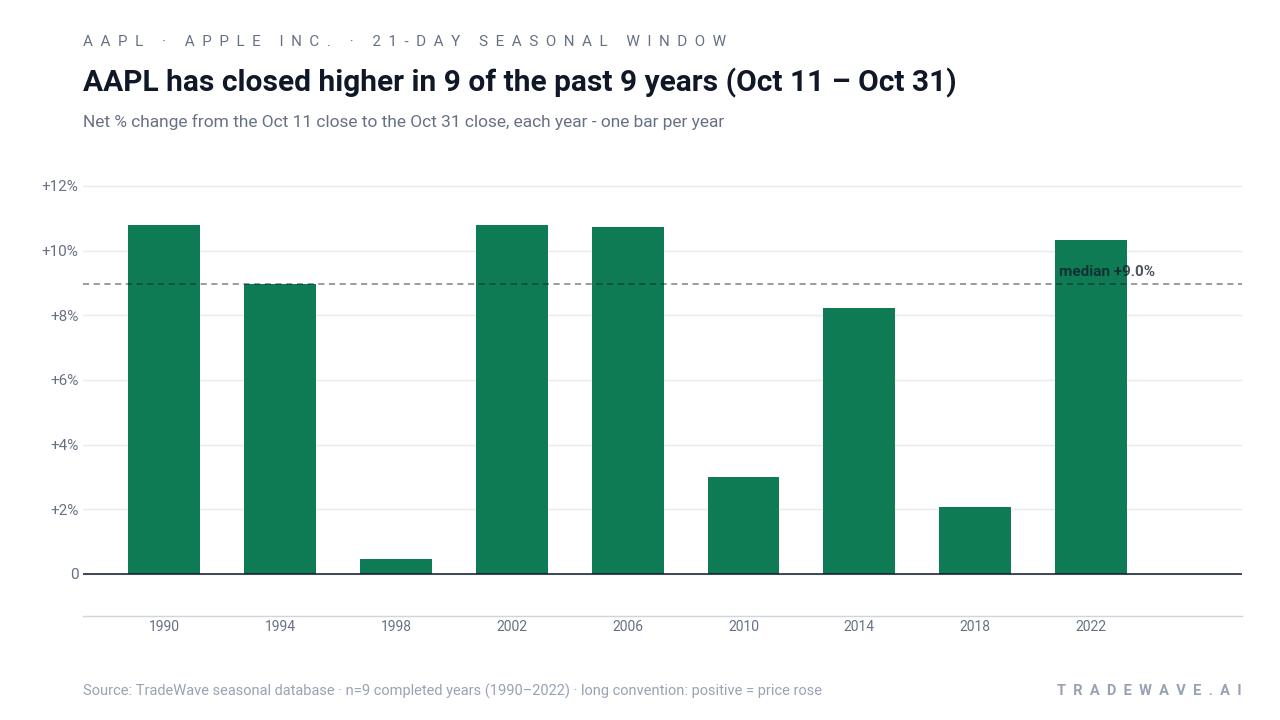
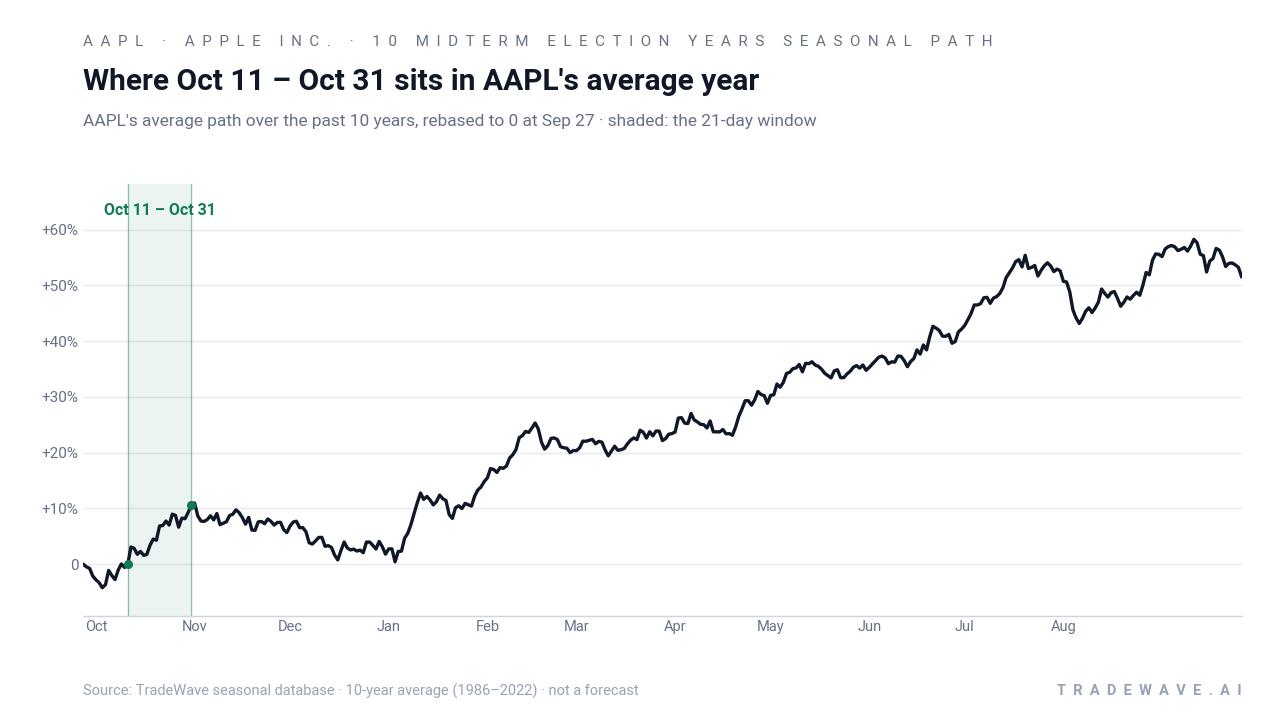
This pattern is grouped by the presidential election cycle, focusing only on the last 10 midterm election years rather than consecutive calendar years. That matters because midterm years often feature tighter policy debates and shifting fiscal expectations, which can change how mega-cap tech trades compared with pre-election or election years.
Across the 10 midterm-year samples, the long trade direction has been rewarded far more often than not. Percent Profitable sits at 90.0%, with 9 winners and just 1 loser, and the all-years average outcome of 6.53% shows that the single down year did not meaningfully blunt the overall upside. The median profit of 8.59% is slightly above the average, which hints that the typical winning year has been solid rather than reliant on one or two outliers.
Looking at individual years, the strongest late-October runs came in 1990, 2002 and 2006, each posting net gains above 10% over the 21-day span. The weakest outcome was 1986, which finished flat despite a maximum favorable move of 1.85% and a maximum adverse move of -6.89% inside the window, a reminder that intraperiod swings can be much larger than the final close suggests.
A second view combines yearly net results with both best and worst intraperiod swings.
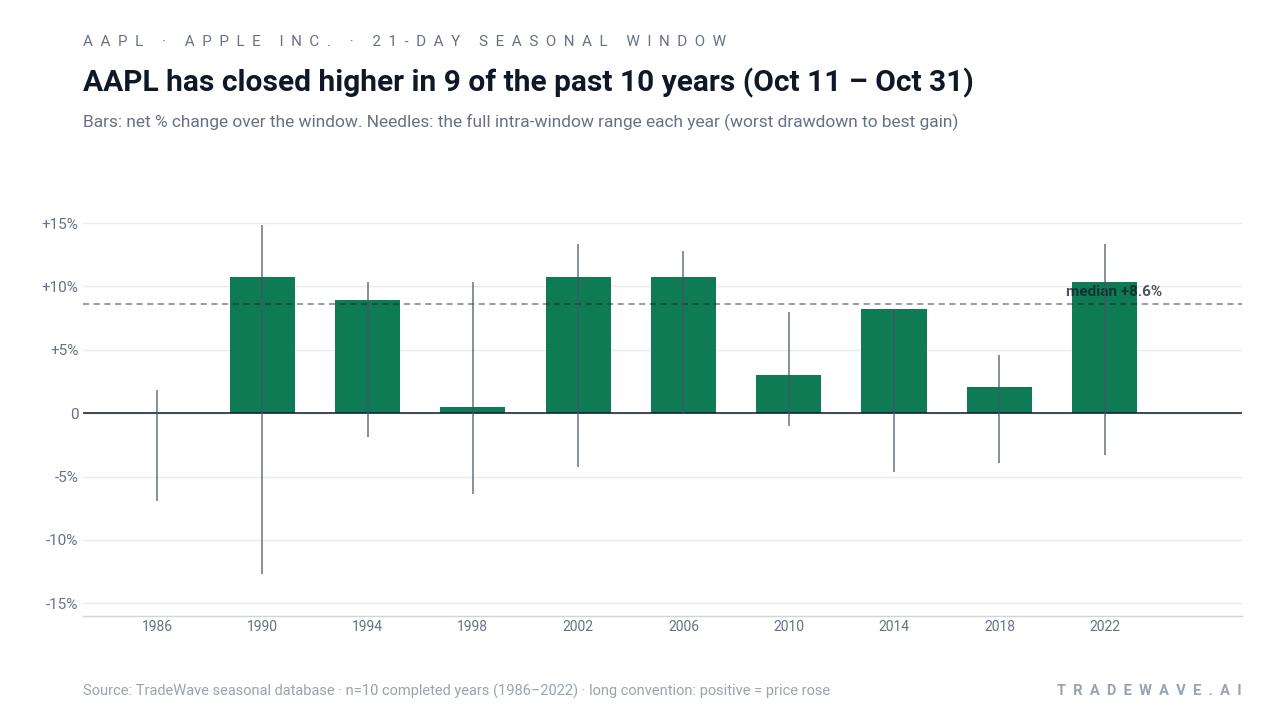
The combined net / maximum favorable move / maximum adverse move profile shows a window that has usually rewarded patience but not without stress. In several years, Apple’s best intraperiod gain ran well ahead of the final close, while the worst drawdown often arrived early in the window before the stock recovered into month-end. The TradeWave Ratio of 2.29 captures how far price has typically traveled in the trade direction within the window, independent of the final result, and aligns with a Sharpe ratio of 1.38 that reflects strong risk-adjusted returns based on end-of-window outcomes.
History does not guarantee future results; adverse excursions (MAE) can be large even in winning windows.
Why does Apple Inc. (AAPL) follow this seasonal pattern?
One likely driver is the clustering of Apple’s fiscal year-end positioning and Q4 earnings expectations around late October, which can pull forward demand for the stock in midterm years. Analysts have also pointed to institutional portfolio rebalancing and sector rotation into large-cap tech as investors look ahead to the historically stronger pre-election year. The pattern may also reflect consumer electronics spending cycles, with investors leaning into iPhone and holiday-season momentum once early demand data is in hand.
What is driving Apple Inc. (AAPL) today?
Apple Inc. slipped 0.33% to 335.92 on Sep 25, a modest pullback that still leaves the stock about 2.7% below its 52-week high and up 23.56% for 2026. Trading volume of roughly 24.25 million shares ran below the 20-day average of 43.30 million, consistent with Barron’s recent snapshot that showed volume of 24.37 million against an average of 52.77 million and short interest of 128.75 million shares, down 7.87% from the prior reading.[5]
The near-term narrative is dominated by Apple’s Sep 9 hardware event, where the company unveiled the foldable iPhone Duo, iPhone 18 Pro, Apple Watch Series 12, Apple Watch Ultra 4 and AirPods 5.[4] Coverage has highlighted ongoing demand for the iPhone 18 lineup and Apple’s push into on-device AI, which has supported sentiment toward the stock and the broader consumer electronics group.[2] Apple also sits in the middle of a delicate China backdrop, with reports that Tim Cook is among the senior U.S. tech executives meeting Chinese leadership, a reminder that Greater China remains a critical market and policy risk for the company.[1]
On the calendar, Apple’s next earnings report is scheduled for Oct 29, covering its fiscal Q4 2026 period, which lands squarely inside the late-October seasonal window.[1] That timing means any surprise on iPhone demand, AI monetization or China trends will collide directly with a part of the year that has historically seen outsized moves in the stock.
The chart below situates the latest move against the past year of trading and a historical seasonal projection.
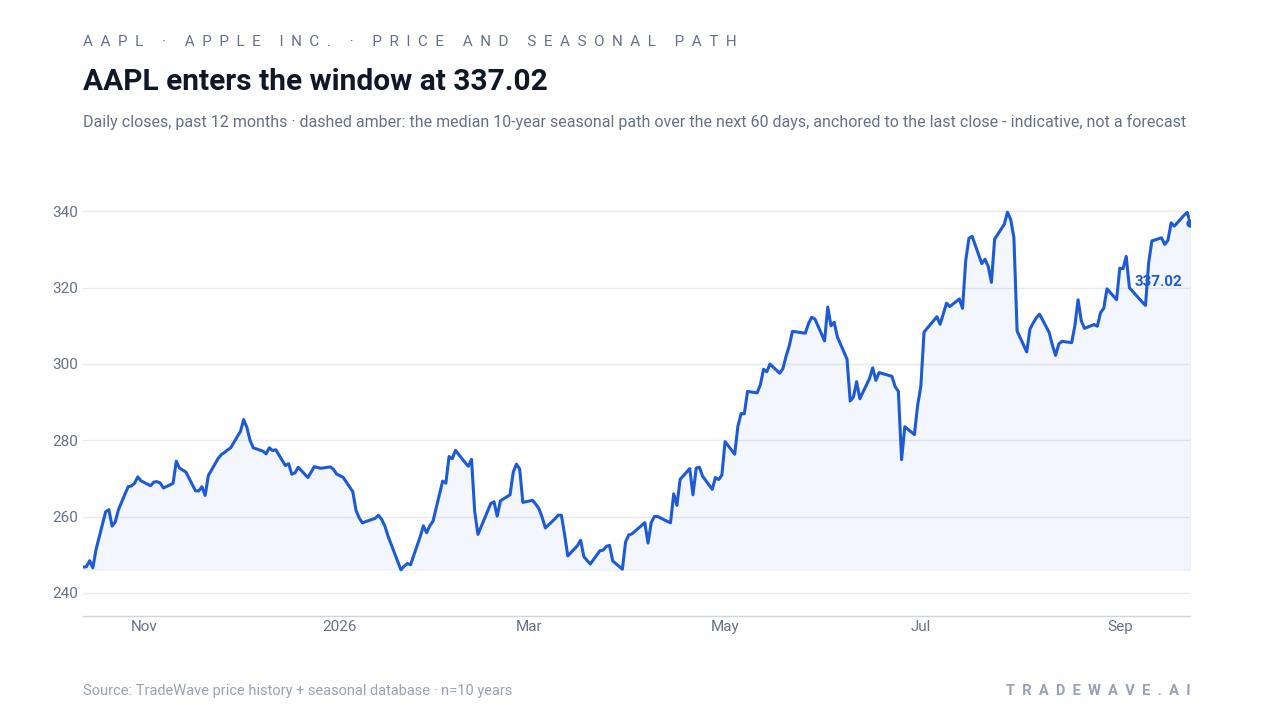
Apple’s role as a heavyweight in the S&P 500 and Nasdaq means any deviation from its usual late-October pattern could ripple across broader indices. With the market wrapping up the midterm election year and heading into the historically supportive pre-election phase, traders are watching whether Apple’s seasonal tailwind, product cycle and policy backdrop line up or clash in the weeks ahead.[3]
Sources
- The Wall Street Journal (content from Dow Jones / Barron's Online) - Apple Inc. (AAPL) Stock Price Today
- Yahoo Finance - Apple Inc. (AAPL) Stock Price, News, Quote & History - Yahoo Finance
- MarketWatch - Apple Inc. Stock Quote (U.S.: Nasdaq) - AAPL
- Morningstar - Apple Inc AAPL - Morningstar Quote/Analysis
- Barron's / FactSet (via Barron's market data) - AAPL | Apple Inc. Stock Overview (U.S.: Nasdaq) | Barron's
About this seasonal analysis
Seasonal pattern data is sourced from TradeWave.ai, which analyzes historical price behavior across annual calendar windows going back up to 30 years. Read the full data methodology or the book The 100-Year Pattern by Afshin Moshrefi (2026 edition). Past performance of seasonal patterns does not guarantee future results. This article is for informational purposes only and does not constitute investment advice.