Microsoft (MSFT) Has Rallied in 9 of 9 Midterm Oct 11-20 Windows, Averaging 4.5% Gains
Microsoft is heading into a 10-day October window that has never been down in midterm election years, with shares hovering near record territory and AI spending still in the spotlight.
Price as of Oct 1, 2026: $512.80 (last close).

What is the seasonal pattern for Microsoft (MSFT)?
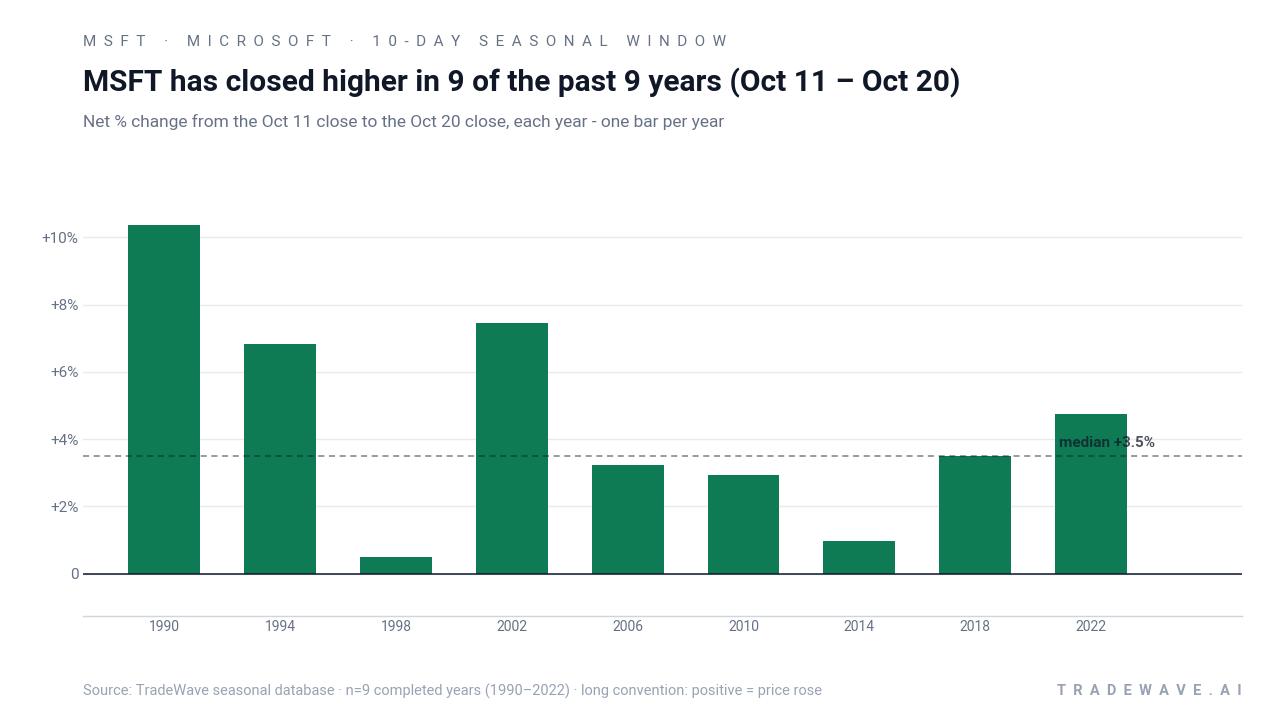
Microsoft has risen in 9 of 9 years during this Oct 11–Oct 20 midterm-year window, with an average gain of 4.5% in winning years.
- 9 for 9 in this window, averaging 4.5% gains in winning years across the last 9 midterm election years.
- Seasonal bias is bullish from Oct 11 through Oct 20, with a long trade direction and 100.0% Percent Profitable (9 winners, 0 losers).
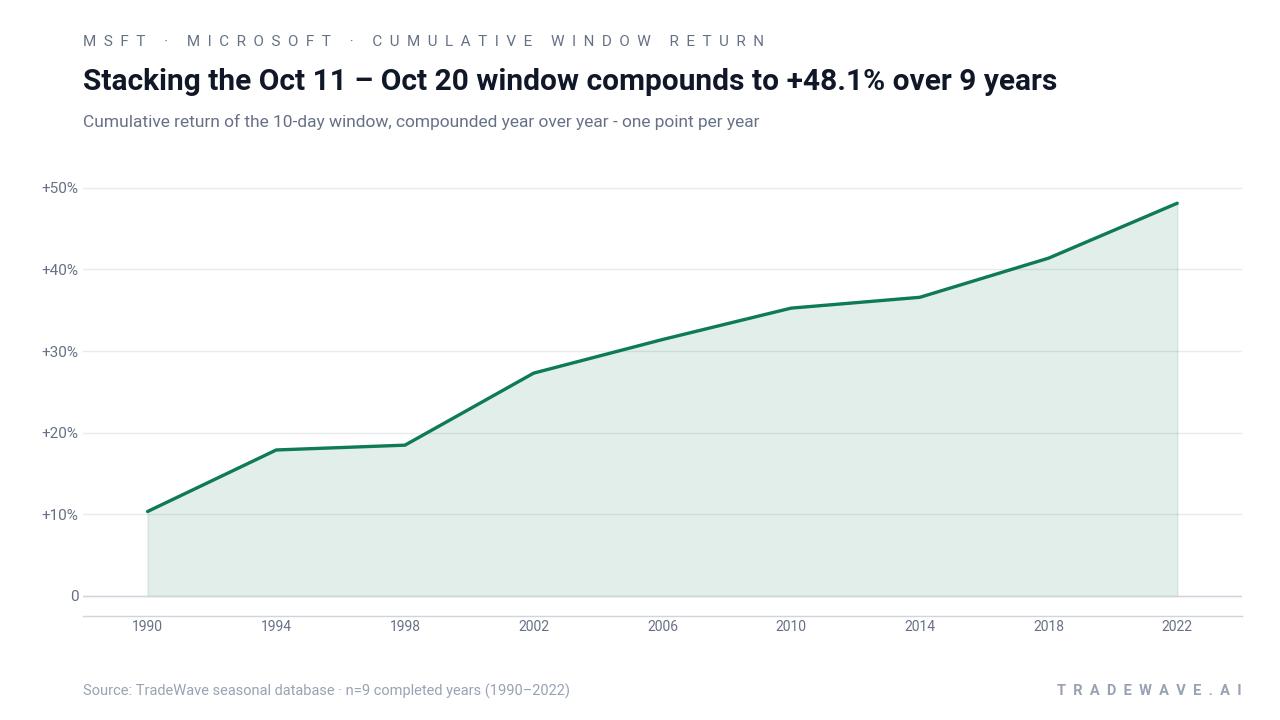
- Average profit of 4.5% over the 10-day stretch, with a median gain of 3.51% and a cumulative return of 48.12% when the window is stacked over time.
- TradeWave Ratio of 2.28 suggests price has typically traveled meaningfully in the trade direction within the window, not just at the close.
- A Sharpe ratio of 1.38 for this slice of the calendar points to a historically favorable risk-adjusted profile for longs.
- Individual years have still seen notable intraperiod drawdowns, so timing and risk controls matter even in a clean 9-for-9 record.
According to historical data from TradeWave.ai, this mid-October stretch has behaved very differently from an average month for Microsoft. The next section walks through how that pattern has lined up with past midterm election years and what it means as the 2026 window approaches.
How has Microsoft (MSFT) traded in the Oct 11–Oct 20 midterm-year window?
Microsoft has closed higher in every single Oct 11–Oct 20 window across the last 9 midterm election years, averaging a 4.5% gain for longs. Shares finished Friday at $512.80 after a quiet session that left the stock about 5.9% below its 52-week high of roughly $544.72, with a one-month return of 2.37% and 20-day average volume near 21.3 million shares.
Because this pattern is grouped by the presidential election cycle, it reflects how Microsoft has behaved specifically in the late part of midterm election years, not just any October. That matters as 2026 wraps up the current midterm year and markets look ahead to the historically stronger “year before the presidential election,” when risk appetite and policy clarity often improve for large-cap tech.
This seasonal window begins on Oct 11 and spans 10 days. Historically, during this period in midterm election years, Microsoft has shown a strong upside tendency for long positions, with 100.0% of the 9 completed windows finishing in the green and no losing years in the sample. Average gains of 4.5% sit above the 3.51% median, which hints that a few stronger years have pulled the mean higher, but even the softer outcomes have still been positive.
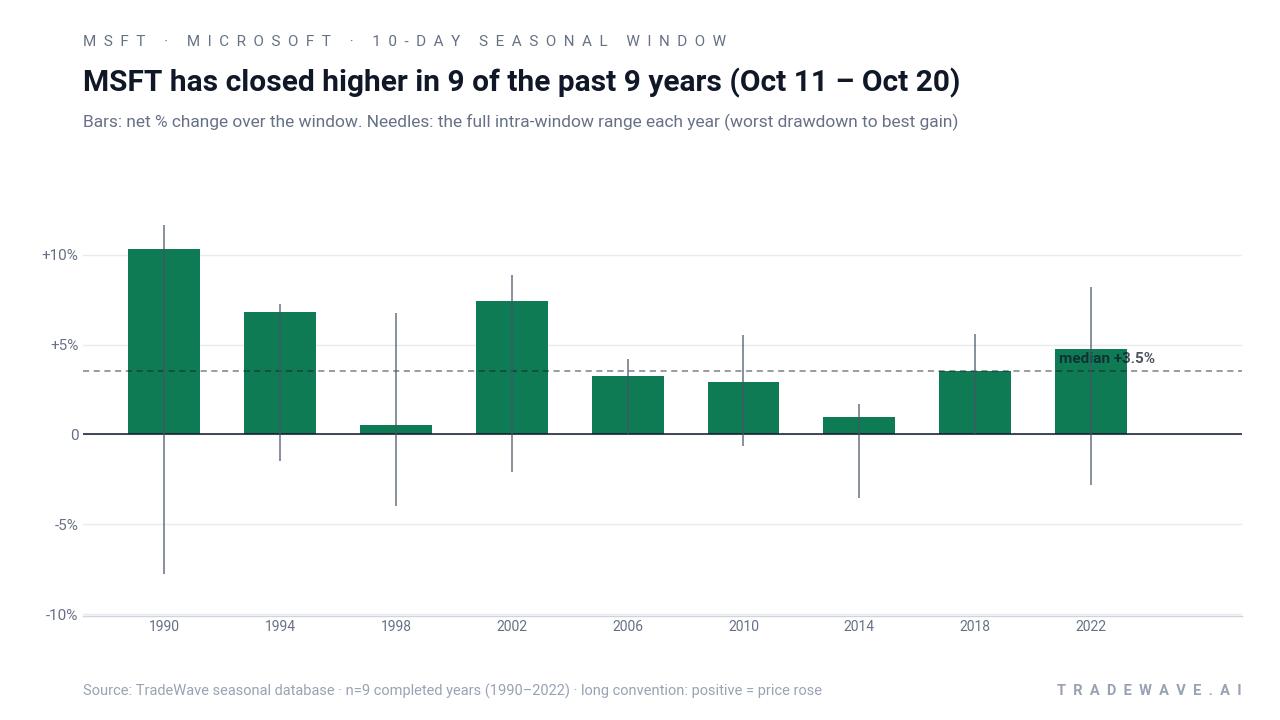
The per-year breakdown shows how that plays out in practice. The strongest year in the sample was 1990, when Microsoft rallied 10.35% between the Oct 11 and Oct 20 closes, after reaching a best intraperiod gain of 11.64% and enduring a worst drawdown of 7.76% from the entry. At the other end of the spectrum, 1998 delivered just a 0.5% net gain, even though the stock at one point was up 6.77% inside the window and also saw a 4.01% adverse move from the starting level.
Those best and worst excursions are captured by what traders call maximum favorable move and maximum adverse move. In plain English, they show how far Microsoft has tended to run up at its peak during the window and how deep the worst pullback has been before the period ends. Across the 9 midterm-year samples, the pattern has combined solid closing gains with intraperiod swings that can be several percentage points in either direction.
Yearly net and intraperiod swings highlight how upside and downside have both shown up inside this 10-day stretch.
History does not guarantee future results; adverse excursions can be large even in winning windows, and past 100% hit rates can always break.
Add it up: nine for nine, a 4.5% average gain, and a 48.12% cumulative return across the last 9 midterm election years make this one of Microsoft’s cleanest short seasonal windows on the calendar.
Why does Microsoft (MSFT) follow this seasonal pattern?
One likely driver is the way the presidential election cycle shapes risk appetite for mega-cap tech in the back half of midterm years. By mid-October, investors have more clarity on fiscal and regulatory priorities, and portfolio managers often rotate back into growth and cloud leaders ahead of the historically stronger “year before the presidential election.” For Microsoft specifically, this window also tends to sit between major earnings events, which can give large institutions room to add exposure to cloud and AI themes without immediate headline risk.
What is driving Microsoft (MSFT) today?
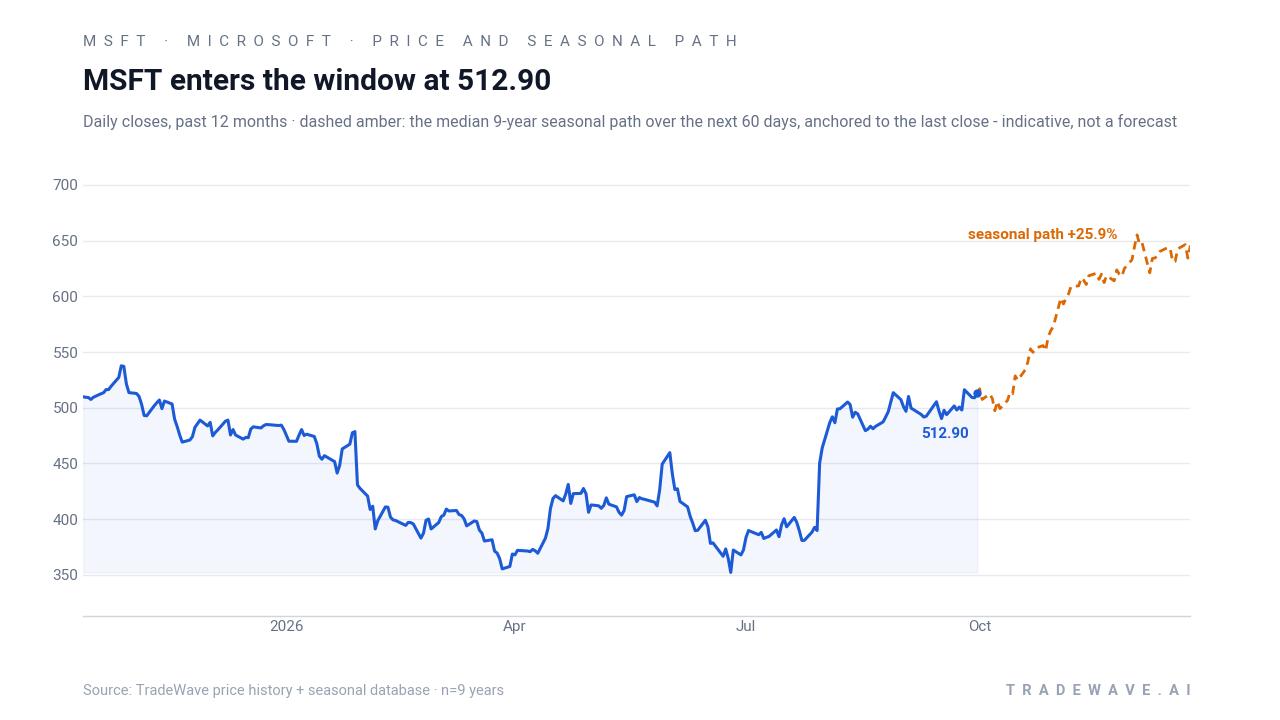
Microsoft ended the prior session at $512.80, down 0.02% on the day, after trading between $512.17 and $522.85 on volume of about 18.9 million shares, modestly below its 20-day average of roughly 21.3 million. The stock sits about 5.9% under its 52-week high near $544.72 and well above its 52-week low around $347.89, reflecting a powerful multi-quarter run that has been fueled by cloud and AI demand.
In July 2026, Microsoft reported fiscal Q4 revenue of $90.0 billion and GAAP diluted EPS of $4.81, with Intelligent Cloud revenue around $39.3 billion and Business Productivity & Processes near $37.8 billion, underscoring how central Azure and AI workloads have become to the story.[3] Commentary around that report highlighted elevated capital spending tied to AI infrastructure, with capex figures in the tens of billions and investors focused on how quickly those investments translate into durable free cash flow.[3] Earlier in the year, analysis of the January earnings season framed a similar dynamic: strong top-line and earnings beats, but near-term pressure on sentiment as Azure growth and heavy capex weighed on cash metrics.[1]
Sector-wise, Microsoft remains a bellwether for cloud and AI, with its Intelligent Cloud segment and AI offerings cited as primary drivers of revenue growth and investor positioning.[3] Macro commentary around the name has repeatedly pointed to large AI-related capital spending and data-center capacity demands as both an opportunity and a risk, since the company is effectively front-loading investment to secure long-term leadership in AI infrastructure.[3] That backdrop means any pullback in AI enthusiasm, changes in rate expectations, or signs of enterprise budget fatigue could matter disproportionately for Microsoft as the market heads into this historically strong mid-October trading window.
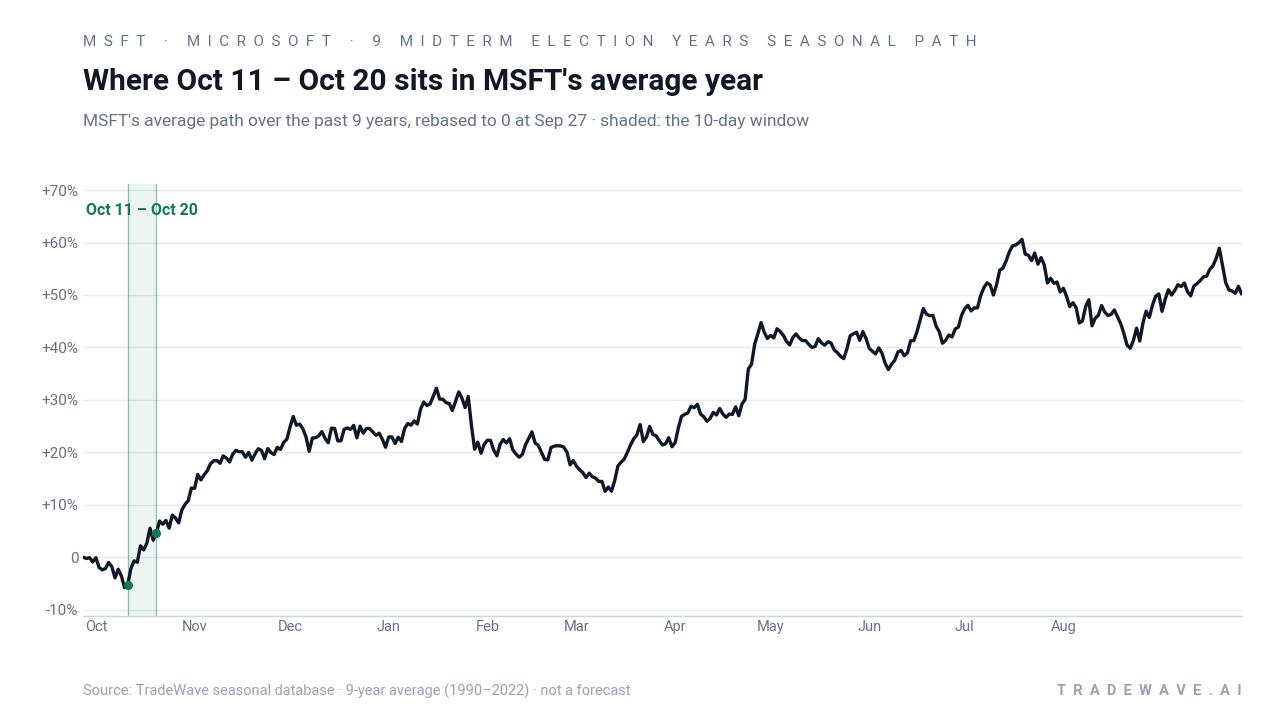
The chart below situates the latest move in its recent multi-month context alongside the historical seasonal projection.
What should traders watch as the Oct 11–Oct 20 window approaches?
First, the calendar. The 10-day window opens on Oct 11, right as markets transition from the concluding midterm election year into the run-up to the year before the presidential election, a phase that has often been friendlier to large-cap growth. How Microsoft behaves inside that slice will show whether the 9-for-9 pattern is still exerting influence or if the stock is starting to trade more on idiosyncratic AI and capex headlines.
Second, levels. On the upside, traders will be watching whether Microsoft can retest or break above the $544 area that marks its 52-week high, especially if the stock enters the window still within single-digit distance of that mark. On the downside, any quick slide back toward the 50-day moving average around $481.83 would signal that intraperiod drawdowns are tracking the deeper historical adverse moves seen in years like 1990 and 1998, even if the window ultimately finishes higher.
Third, catalysts. While there is no imminent earnings date on the calendar, any fresh commentary on AI infrastructure spending, data-center capacity, or Azure growth from management appearances or industry conferences could intersect with this window. Given how much of Microsoft’s narrative is tied to cloud and AI, even incremental updates on capex pacing or demand trends can shift sentiment quickly.[3]
Finally, behavior inside the window itself will be the real test. A pattern of early weakness followed by strong closes would rhyme with several past years where Microsoft saw meaningful intraperiod drawdowns but still finished the window solidly higher. A clean grind higher with shallow pullbacks would reinforce the idea that this mid-October stretch remains a sweet spot for the stock in midterm election years. A sharp break of the pattern, with a decisive down 10-day run, would be a clear signal that the election-cycle seasonal tailwind has faded and that AI, rates, or macro forces are taking the driver’s seat.
Sources
- Seeking Alpha - Microsoft: This Is An Earnings Dip You Want To Buy (NASDAQ:MSFT)
- Yahoo Finance - Microsoft beats Q4 expectations, as Azure revenue tops $100 billion
- Microsoft (Investor Relations) - Press Release & Webcast - Earnings Release FY26 Q4
- Seeking Alpha - Microsoft's Lack Of Leadership In AI, Wait (NASDAQ:MSFT)
- Barchart - Microsoft Stock Just Flashed an Ultra-Rare Bullish Signal for Options Traders
- Barchart - Microsoft is Bouncing Back from Its Post-Earnings Price Crash, But Watch This Before You Buy MSFT Stock
About this seasonal analysis
Seasonal pattern data is sourced from TradeWave.ai, which analyzes historical price behavior across annual calendar windows going back up to 30 years. Read the full data methodology or the book The 100-Year Pattern by Afshin Moshrefi (2026 edition). Past performance of seasonal patterns does not guarantee future results. This article is for informational purposes only and does not constitute investment advice.