Ford Motor Company (F) Sees Aluminum Supply Return Just as Bullish Mid-October Run Nears
Ford Motor Company is heading toward a historically bullish Oct 12–24 trading window even as the stock sits near $12.60 and up about 12% this year, with investors juggling EV demand worries, earnings momentum and a shifting policy backdrop.
Price as of Sep 24, 2026: $12.60 (last close).

What is the seasonal pattern for Ford Motor Company (F)?
Ford Motor Company has risen in 8 of 10 years during this Oct 12–24 midterm-year window, with an average gain of 5.67% in winning years.
- 8 for 10 in this window, with winning years averaging 5.67% gains over the 13-day stretch.
- Seasonal window runs from Oct 12 through Oct 24 in the last 10 midterm election years, aligned with a long trade direction.
- Percent Profitable is 80.0%, with 8 winners and 2 losers across the historical sample.
- Including all years, Avg Profit - All is 4.05%, reflecting the drag from the two losing windows.
- The TradeWave Ratio of 1.05 suggests price typically travels meaningfully in the long direction within the window, while the Sharpe ratio of 0.79 points to a solid risk-adjusted profile.
- Some years saw sizable intraperiod swings, so traders have historically faced real drawdowns even when the window finished higher.
According to historical data from TradeWave.ai, this mid-October stretch has behaved differently from an average month for Ford. The next section looks at how that election-cycle pattern has played out and where the upcoming window fits into Ford’s broader trading year.
How has Ford Motor Company (F) traded in the Oct 12–24 midterm-year window?
Ford Motor Company has risen in 8 of the last 10 midterm election years during the Oct 12–24 window, averaging 5.67% gains in the winning runs. Shares finished the prior session at $12.60, down 2.6% on the day but still about 12% higher year to date. That mix of a constructive year and a historically strong late-October seasonal pattern gives traders a defined 13-day window to watch as the market wraps up the midterm election year and transitions into the typically more risk-on pre-election phase.
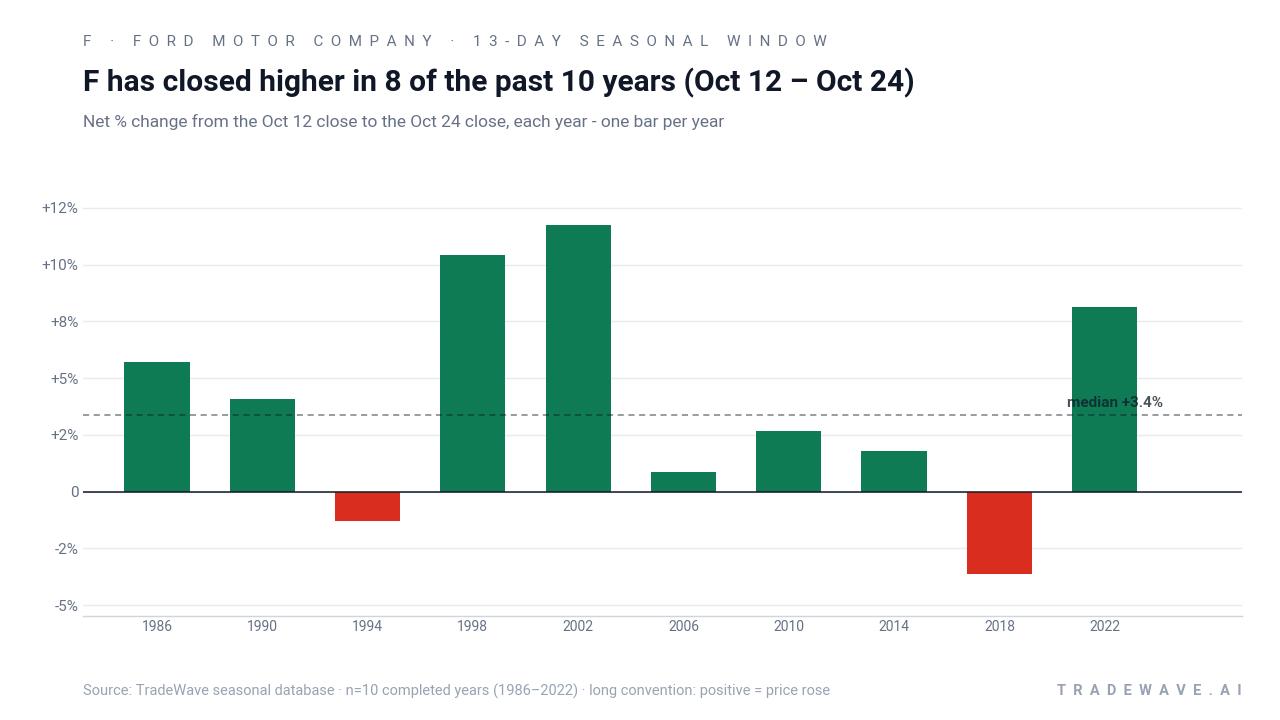
Grouping the data by presidential election cycle matters here because this window only looks at the last 10 midterm election years, not every calendar year in a row. Midterm years often feature policy uncertainty, shifting fiscal priorities and sector rotation ahead of the pre-election year, so Ford’s late-October behavior in those specific years can differ from its usual autumn trading pattern.
This seasonal window begins on Oct 12 and spans 13 days. Historically, during this period in midterm election years, Ford Motor Company has shown a bullish tendency that aligns with a long trade direction. The Percent Profitable reading of 80.0%, with 8 winners and 2 losers, is strong for such a short window and suggests that late October has often been a favorable slice of the calendar for long exposure in Ford during this phase of the cycle.
In the winning years, Ford’s average gain of 5.67% over the window stands out for a two-week stretch, while including all years trims the average to 4.05% as the two losing windows pull down the overall result. That gap between Avg Profit and Avg Profit - All is a reminder that when the pattern misses, it can miss by enough to matter, even if the long-run seasonal trend has leaned higher. The median profit of 3.38% sits below the average, which hints that a few strong years, such as 1998 and 2002, did some heavy lifting.
Looking at individual years, 2002 delivered an 11.73% net gain with a maximum favorable move of 25.72% from entry, while 1998 posted a 10.44% net return with a 14.28% best run-up. On the weaker side, 2018 saw a 3.62% loss with a worst drawdown of 5.21%, and 1994 slipped 1.29% with a 3.45% intraperiod drop. Those maximum favorable and adverse excursions show that even in a short window, Ford has historically swung several percentage points in both directions before settling at the close.
The MAE and MFE profile across the 10 years lines up with that story. Maximum favorable excursions in the stronger years often pushed into high single digits or better, while maximum adverse excursions in several years ran between roughly 3% and 5% from the entry level. That combination points to a window where upside has tended to dominate over the full sample, but where traders have still had to sit through meaningful drawdowns inside the trade.
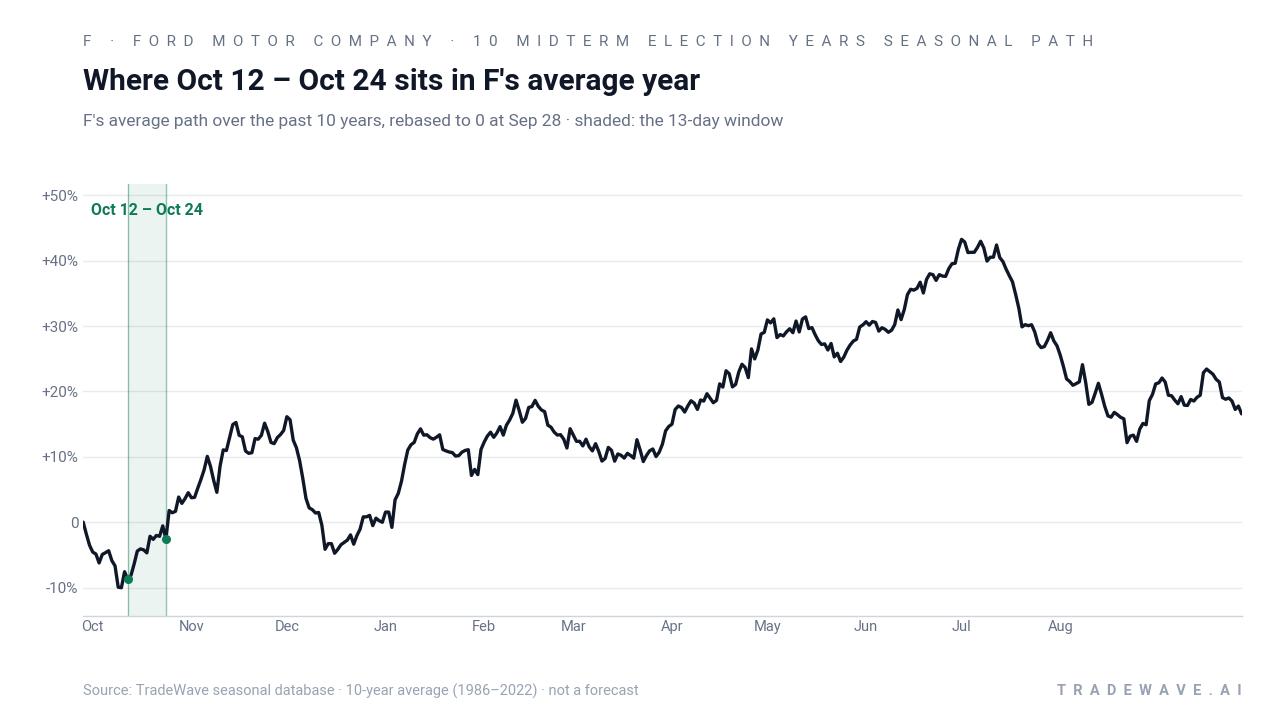
Yearly net and intraperiod ranges highlight how often upside has won out despite sizable swings inside the window.
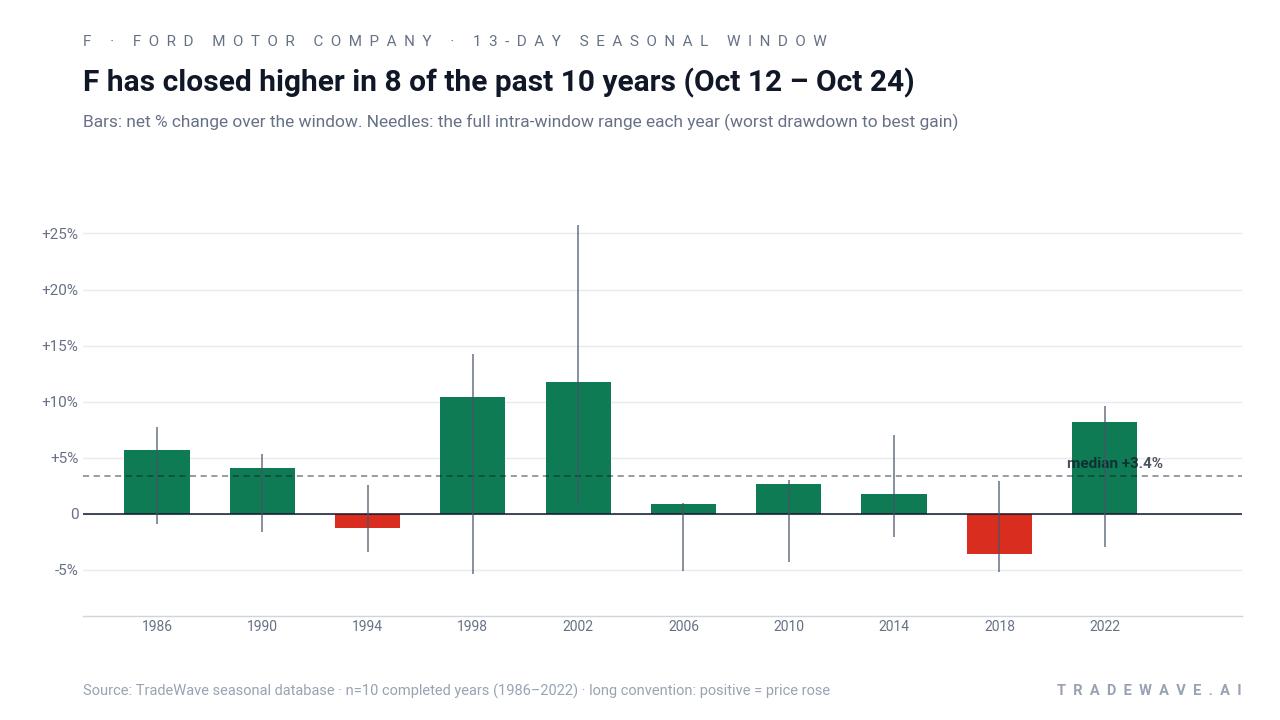
The cumulative chart for this Ford Motor Company trading window compounds those 13-day slices across the last 10 midterm election years into a 47.18% total gain. Add it up and the pattern has rewarded sticking with the window over multiple cycles, even though two years finished in the red. The Sharpe ratio of 0.79 reflects that the risk-adjusted profile has been solid rather than spectacular, but for a short seasonal regime tied to a specific election phase, the consistency is notable.
History does not guarantee future results; adverse excursions (MAE) can be large even in winning windows.
Why does Ford Motor Company (F) follow this seasonal pattern?
One likely driver is the way midterm election years cluster key policy and macro catalysts into the autumn, which can influence auto demand expectations and industrial stocks together. Analysts have also pointed to portfolio repositioning into the pre-election year, when risk appetite has often improved and investors have been more willing to add cyclical exposure like autos. For Ford specifically, this late-October stretch may capture a mix of earnings reactions, year-end production guidance and sector rotation that has historically tilted the short window in favor of long positions.
What is driving Ford Motor Company (F) today?
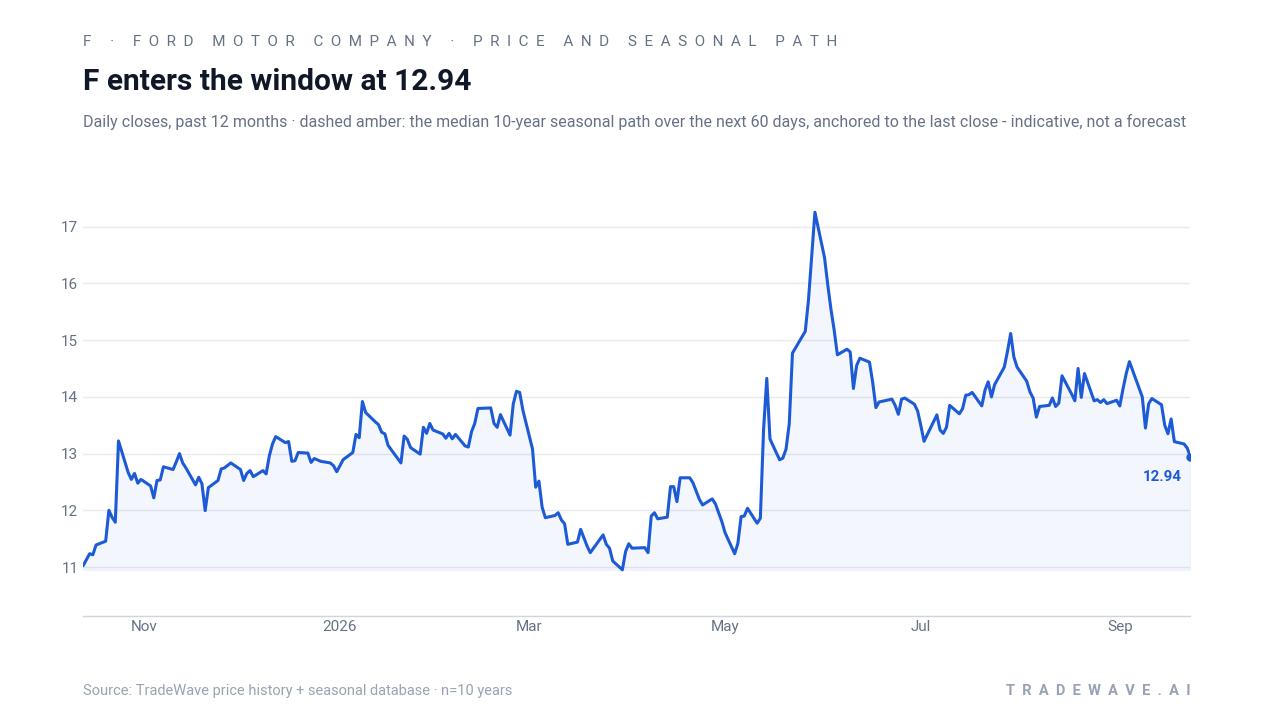
Ford Motor Company closed the latest session at $12.60, down 2.6% on the day, but still about 12% higher year to date as the stock trades in the lower half of its 12-month range. The move comes after a summer defined by earnings, supply normalization and shifting expectations for Ford’s energy and EV strategy, all against a backdrop of choppy auto demand.
On Jul 28, 2026, Ford reported second-quarter results that topped expectations, helped by the easing of an aluminum supply crunch as key supplier Novelis restarted production, which supported F-Series output and calmed fears about a prolonged “aluminum crisis.”[2][3] The same earnings coverage highlighted that investors were watching for any change in guidance as production normalized and management weighed capital allocation between traditional trucks, EVs and new businesses.[2]
Earlier in the year, Ford’s push into energy storage and grid services drew fresh attention. In May 2026, the company announced its first customer for the Ford Energy business, a move that prompted bullish commentary from Morgan Stanley on the potential for $500 million to $600 million of run-rate EBIT at 20 GWh of capacity and underscored the strategic value of Ford’s relationship with battery giant CATL for compliant energy storage systems in the United States.[4][5] That pivot helped fuel a sharp rally in the stock around the announcement as investors reassessed Ford’s earnings mix beyond pure vehicle sales.[4][5]
At the same time, Ford’s core auto franchise has been navigating a tougher demand backdrop. In Jul 2026, the company reported that second-quarter U.S. vehicle sales fell 10.3% to 549,200 units, with weak EV demand and model phase-outs weighing on volumes even as some high-margin models like the Bronco and Maverick Hybrid set records.[6] That split picture has kept the stock sensitive to every data point on EV adoption, truck pricing and incentives as the industry adjusts to a slower, more selective electrification curve.
Insider activity has been active but balanced rather than one-way. MarketBeat data through early July showed aggregate insider purchases of 140,000 shares over 24 months for about $1.93 million, alongside insider sales of 30,000 shares totaling roughly $330,000, plus a handful of disclosed trades by members of Congress.[7] The mix suggests ongoing engagement from insiders without a clear directional signal, which leaves the seasonal pattern and macro backdrop as more prominent guides for short-term traders.
The chart below situates the latest move in its recent multi-month context and overlays the median seasonal path into the upcoming window.
What should traders watch in Ford Motor Company (F) during this window?
The key near-term milestone is the calendar itself: the Oct 12 start of the 13-day seasonal window that has historically favored long positions in Ford during midterm election years. Traders will be watching how the stock behaves as that date approaches, especially if it remains near current levels around $12 to $13, where prior rallies and pullbacks have often started.
On the macro and policy side, any fresh headlines on U.S. auto demand, EV incentives, tariffs or industrial policy could matter more than usual, given that this window sits at the end of the midterm election year and just ahead of the pre-election year, when risk appetite has often improved. Updates on Ford’s production cadence, particularly around F-Series and high-margin SUVs, as well as any incremental news on the Ford Energy business or battery partnerships, could also shape how closely this iteration tracks the historical seasonal trend.[2][3][4][5][6]
From a price-action standpoint, traders will be looking to see whether intraperiod swings resemble the historical pattern, where maximum favorable moves have often reached high single digits while maximum adverse moves have sometimes pushed 3% to 5% lower before recovering. A rally that builds early in the window with contained drawdowns would be consistent with the past 8 winning years, while a quick break below recent lows with deeper downside excursions would look more like the 1994 or 2018 misses.
Finally, positioning and insider behavior remain secondary but useful context. If insider buying or selling meaningfully accelerates around the window, or if congressional trading activity in Ford picks up, that could add another layer to how investors interpret any divergence from the historical pattern.[7] For now, the main story is simple: Ford is heading into a short, historically bullish mid-October window with a mixed fundamental backdrop and a clear election-cycle lens, giving traders a defined period to test whether this F seasonal trend shows up again.
Sources
- Barron's (Dow Jones) - Ford Stock Needs Earnings to Clear a Rising Bar. What to Watch.
- CNBC - Ford Motor is set to report earnings after the bell. Here's what Wall Street expects
- Barron's (Dow Jones) - Ford Stock Jumps After Earnings Beat. The Aluminum Crisis Is Over.
- CNBC - Ford lands its first customer for energy business. Buy this pivot by the auto giant?
- Yahoo Finance (via Investing.com / Morgan Stanley commentary) - Ford shares jump 6% as Morgan Stanley hails CATL-backed energy business
- Yahoo Finance - Ford Q2 sales slide 10% on EV drop and model phase-outs; Bronco and Maverick hybrid set records
- MarketBeat - Ford Motor (F) Insider Trading Activity 2026
About this seasonal analysis
Seasonal pattern data is sourced from TradeWave.ai, which analyzes historical price behavior across annual calendar windows going back up to 30 years. Read the full data methodology or the book The 100-Year Pattern by Afshin Moshrefi (2026 edition). Past performance of seasonal patterns does not guarantee future results. This article is for informational purposes only and does not constitute investment advice.