Merck & Co. (MRK) Has Risen in 14 of 15 Midterm Oct-Apr Windows, Averaging Nearly 20% Gains
Merck & Co. is approaching a historically powerful Oct 15–Apr 29 trading window even as shares hover near $144 with modest year-to-date gains and fresh options activity hinting at growing interest in the stock’s next leg.
Price as of Sep 15, 2026: $143.79 (last close).

What is the seasonal pattern for Merck & Co. (MRK)?
Merck & Co. has risen in 14 of 15 years during this Oct 15–Apr 29 midterm-year window, with an average gain of 19.88% in winning years.
- 14-for-15 record in this window, with winning years averaging 19.88% gains and only one small losing year.
- Seasonal window runs from Oct 15 and spans 197 days, covering late midterm election year into the start of the pre-election year.
- Percent Profitable is 93%, with 14 winners and 1 loser across the last 15 midterm election years.
- Including all years, Avg Profit - All is 19%, showing that the lone down year barely dents the long-run seasonal trend.
- Maximum favorable moves have reached more than 50% in some years, while the worst intraperiod drawdown was about 14%, underscoring both upside and risk.
- Trade Direction is long, with a Sharpe ratio of 1.58 and a TradeWave Ratio of 1.8, pointing to historically strong risk-adjusted returns in this MRK seasonal window.
According to historical data from TradeWave.ai, this specific Oct 15–Apr 29 stretch has behaved very differently from an average calendar period for Merck & Co., and the next iteration is approaching as the market wraps up the current midterm election year.
How strong is Merck & Co. (MRK) in the upcoming Oct 15–Apr 29 window?
Merck & Co. has closed higher in 14 of the last 15 midterm election years during the Oct 15–Apr 29 window, with average gains near 20% in winning seasons. Shares finished the prior session at $143.79, down 0.7% on the day and up 5.6% year to date, sitting about 8.4% below their 52-week high of $156.92. MarketBeat flagged unusually large call-option activity in mid-September, with 227,658 calls trading in a single session, a sign that some traders are positioning for more upside in the months ahead.[7] That combination of a powerful historical seasonal trend, a stock consolidating below its highs, and fresh options interest gives this upcoming MRK trading window unusual weight on the calendar.
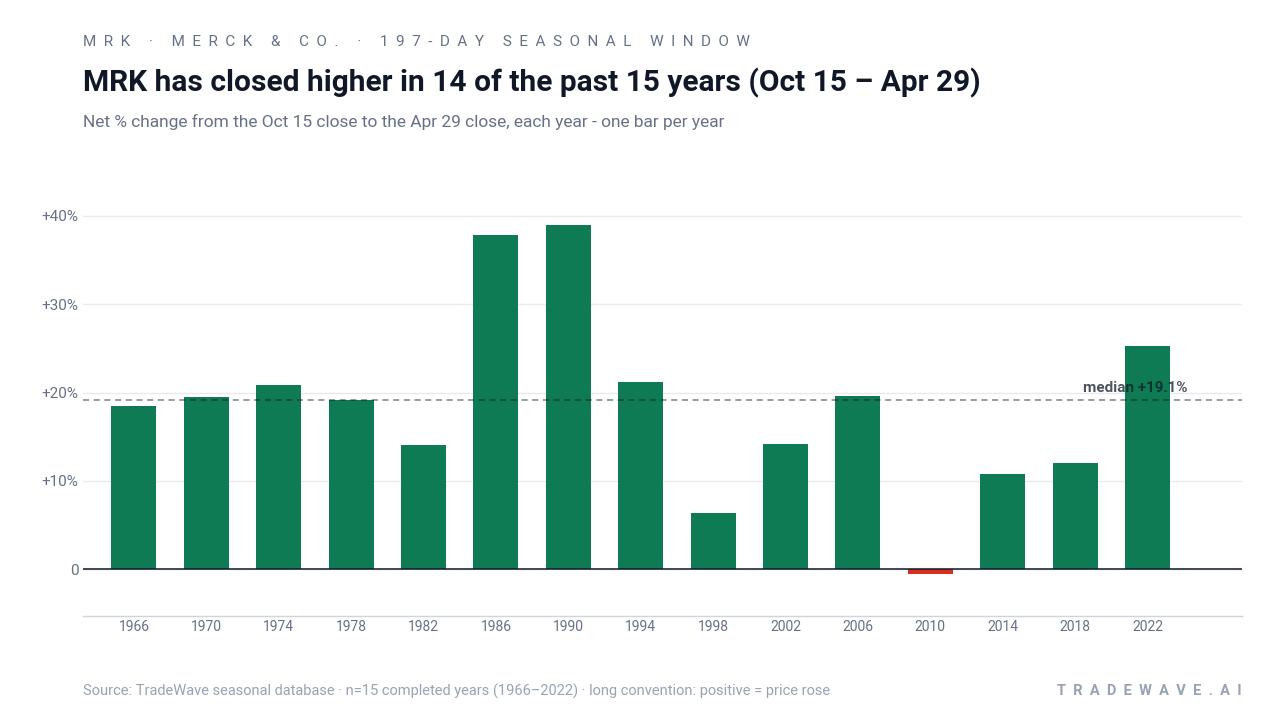
The pattern is built on the last 15 midterm election years, a slice of the presidential cycle that often features policy uncertainty followed by a more supportive backdrop as markets pivot into the year before the presidential election. In this MRK seasonal trend, the trade direction is explicitly long, and the historical record has been overwhelmingly favorable for bulls. Percent Profitable sits at 93%, with 14 winners and just one losing season, and the all-years average gain of 19% is only slightly below the 19.88% average for winners, which tells you the lone down year was shallow rather than catastrophic.
Average loss in that single negative season was just 0.52%, while several winning years posted net returns north of 20%, including 37.83% in 1986 and 38.92% in 1990. Add it up and stacking this 197-day window across the sample compounds to a cumulative return of 1,113%, a figure that reflects how consistently MRK has trended higher between mid-October and late April in midterm election years. The Sharpe ratio of 1.58 indicates that, based on end-of-window outcomes, the risk-adjusted profile has been strong rather than just volatile.
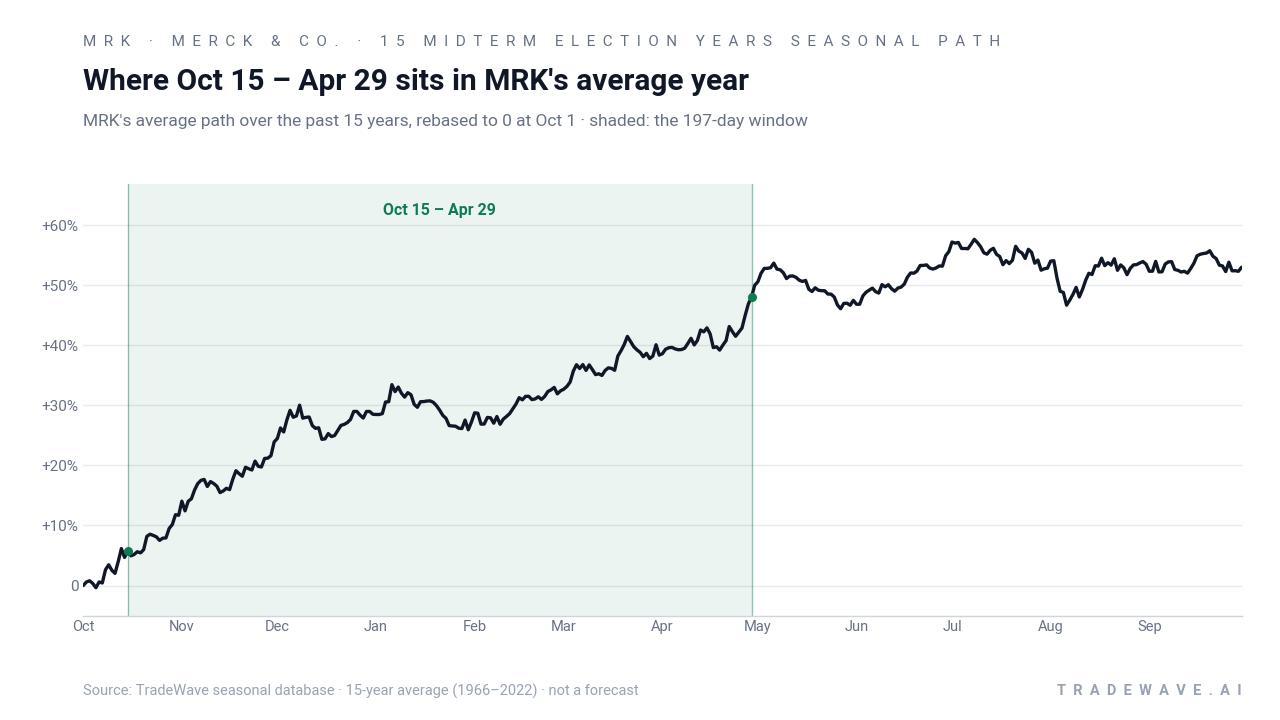
The historical seasonal average path suggests that MRK’s typical year in this window is not a straight line but a steady climb. Gains tend to build as the calendar moves from late October into the first quarter, with the strongest part of the curve often appearing after the turn of the year. That fits with how large pharmaceutical names can benefit from early-year portfolio rebalancing, fresh guidance, and the first wave of macro and policy clarity as Washington shifts from midterm politics toward the next presidential race.
Yearly net and intraperiod swings show how much MRK has tended to move in both directions before settling at its final result.
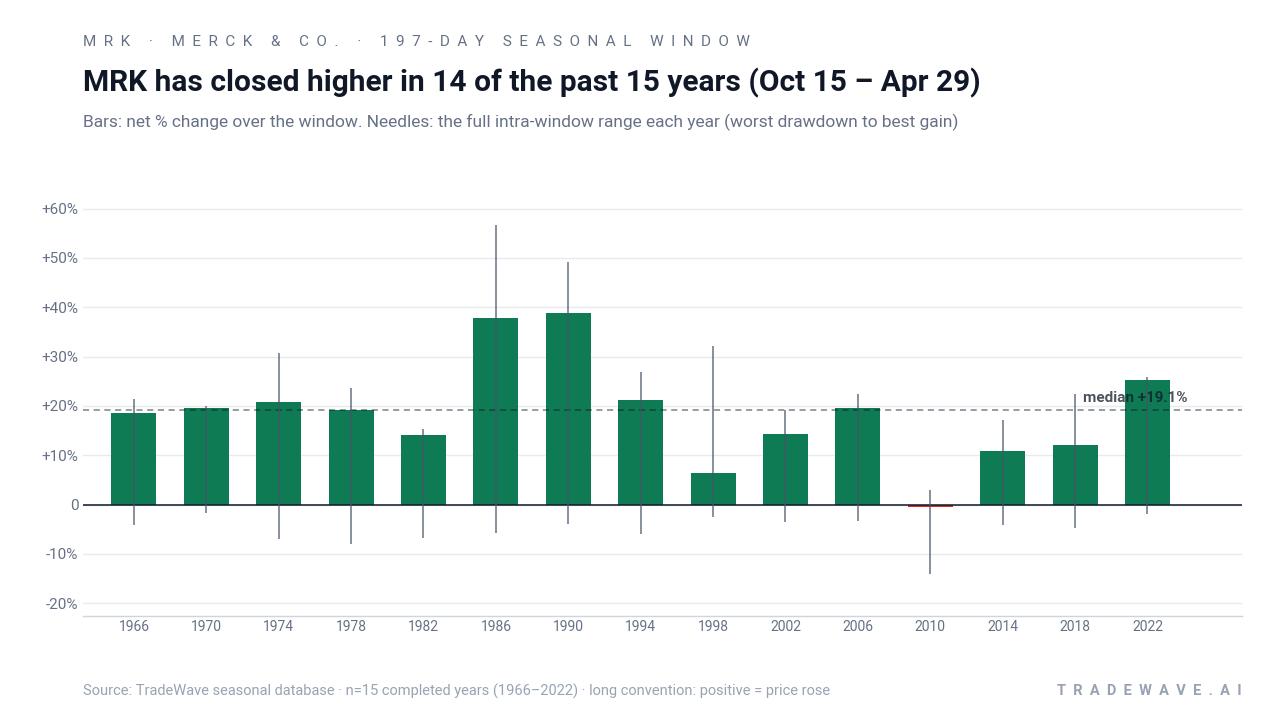
The per-year profile of best and worst excursions shows why this MRK seasonal window has attracted attention. In strong years like 1986 and 1990, maximum favorable moves reached 56.61% and 49.24% respectively, while the worst drawdowns from entry stayed contained around 4% to 6%. The outlier losing year in 2010 saw a modest net decline of 0.52% but a maximum adverse move of 14.05%, a reminder that even in a historically bullish stretch, the stock can experience double-digit drawdowns before recovering. The TradeWave Ratio of 1.8 captures how far price has typically traveled in the trade direction within the window, independent of where it finished, underscoring that this has been an active, not sleepy, part of MRK’s trading year.
History does not guarantee future results; adverse excursions can be large even in winning windows, and MRK has previously seen drawdowns of more than 10% inside this otherwise strong seasonal stretch.
Why does Merck & Co. (MRK) follow this seasonal pattern?
One likely driver is the way Merck’s earnings calendar and drug news flow cluster around late fall and early spring, when guidance updates, trial readouts, and regulatory decisions often hit. Institutional investors also tend to rebalance portfolios around year-end and early in the year, which can favor large, defensive healthcare names as they adjust risk ahead of the presidential election year. This MRK seasonal pattern may reflect that combination of earnings visibility, policy clarity, and sector rotation into pharmaceuticals as investors seek growth with perceived resilience.
What is driving Merck & Co. (MRK) today?
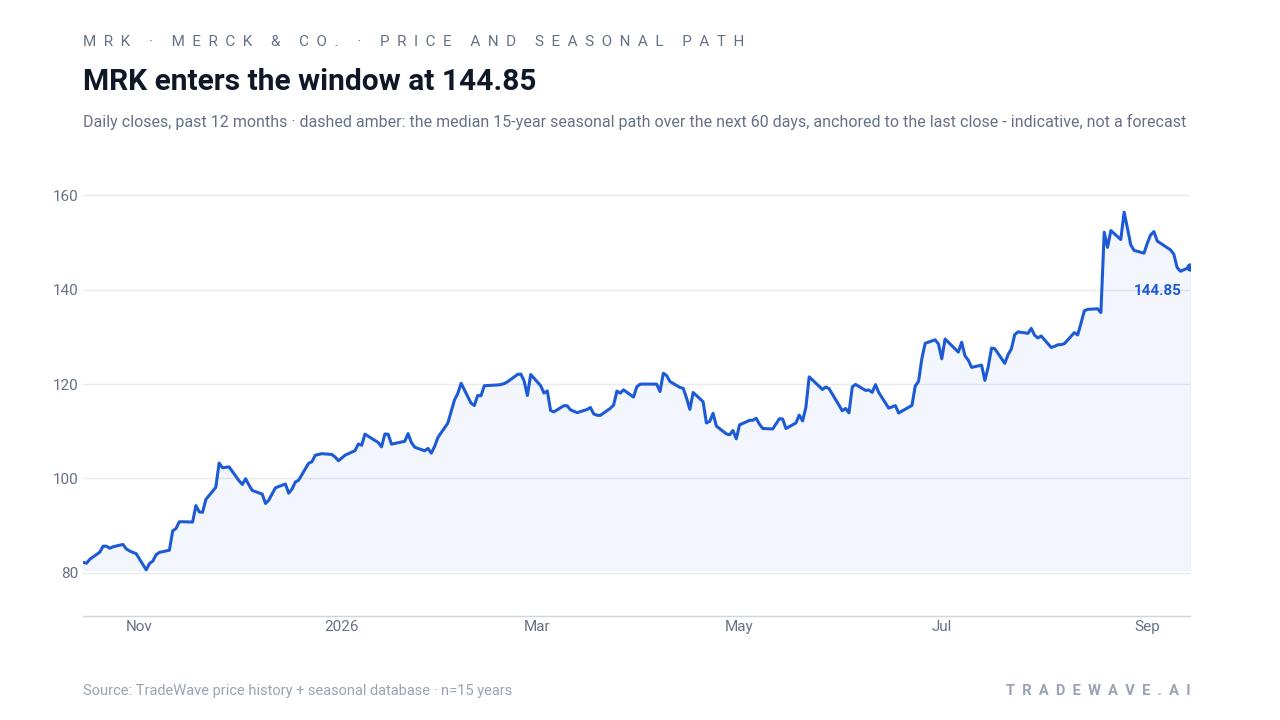
Merck & Co. ended the latest session at $143.79, down 0.7% on the day, leaving the stock up 5.6% so far in 2026 and about 8.4% below its 52-week high of $156.92. The move comes after a stretch in which Merck has leaned on its oncology franchise, particularly Keytruda, to offset softer vaccine sales and position new growth drivers in cardiometabolic, respiratory and infectious disease markets for the next decade.[3][4] In mid-September, MarketBeat highlighted unusually heavy call-option trading in MRK, with 227,658 calls changing hands in a single session, suggesting that some traders are using derivatives to express bullish views or hedge short-term risk around this consolidation zone.[7]
Strategically, Merck has been working to extend its oncology lead and diversify beyond Keytruda’s eventual loss of exclusivity, including earlier 2026 reports that it was in talks to acquire Revolution Medicines for roughly $30 billion to bolster its pipeline.[2] The company has also outlined an ambitious plan for roughly $70 billion in revenue from new growth businesses by the mid-2030s, a macro growth story that keeps the stock in focus for long-horizon investors even as near-term trading is shaped by options flows and the broader healthcare sector’s rotation patterns.[4] For context, Merck’s Q3 2025 results showed revenue and earnings ahead of expectations, with Keytruda sales rising enough to offset a drop in Gardasil, reinforcing the narrative that oncology remains the core engine while vaccines and other franchises cycle through their own demand patterns.[3]
The chart below places MRK’s latest pullback and consolidation in the context of its past year of trading and the typical seasonal path over the next two months.
What should traders watch as this MRK seasonal window approaches?
First, the calendar: this Oct 15–Apr 29 window sits at the junction between the concluding midterm election year and the start of the year before the presidential election, a phase that has often coincided with more supportive policy tone and risk appetite for equities. Historically, MRK has tended to benefit from that shift, with the bulk of its seasonal gains accruing from late fall into early spring. Second, price levels matter: how the stock behaves between roughly $140 and the mid-$150s into October will shape whether the upcoming window starts from a breakout, a range, or a pullback, each of which has looked different in past cycles.
Third, traders will be watching whether the recent burst of call-option activity persists or fades as the window opens.[7] Continued heavy call buying, especially in out-of-the-money strikes or longer-dated expiries, would signal that speculative or hedging demand is building alongside the historical seasonal bias. A sharp drop-off in options volume, or a tilt toward puts, would suggest that the MarketBeat-highlighted spike was a one-off event rather than the start of a positioning trend. Finally, any new guidance updates, pipeline headlines or sector-wide healthcare moves around year-end could either reinforce or challenge the historical MRK seasonal pattern; if the stock once again grinds higher through winter with contained drawdowns, it would mark another entry in a long run of strong midterm-year Oct–Apr windows.
Sources
- Forbes - Why Is Merck Stock Surging?
- Seeking Alpha - Key deals this week: Merck, Glencore, CrowdStrike, Marvell Technology, Steel Dynamics and more
- Reuters - Merck posts higher third-quarter sales as Keytruda growth offsets drop from Gardasil
- Reuters - Merck says new growth opportunities to drive revenue of $70 billion by mid-2030s
- Forbes - Is Merck Stock’s Run Legitimate?
- MarketBeat - Merck & Co., Inc. (MRK) Insider Trading Activity 2026
- MarketBeat - Merck & Co., Inc. (MRK) Target of Unusually Large Options Trading (NYSE:MRK)
About this seasonal analysis
Seasonal pattern data is sourced from TradeWave.ai, which analyzes historical price behavior across annual calendar windows going back up to 30 years. Read the full data methodology or the book The 100-Year Pattern by Afshin Moshrefi (2026 edition). Past performance of seasonal patterns does not guarantee future results. This article is for informational purposes only and does not constitute investment advice.