Merck & Co. (MRK) Has Rallied in 14 of 15 Midterm Oct 20-Apr 29 Windows, Averaging 18.11%
Merck & Co. is trading near record territory as it heads toward an Oct 20–Apr 29 seasonal window that has historically favored the bulls in midterm election years.
Price as of Sep 21, 2026: $149.50 (last close).

What is the seasonal pattern for Merck & Co. (MRK)?
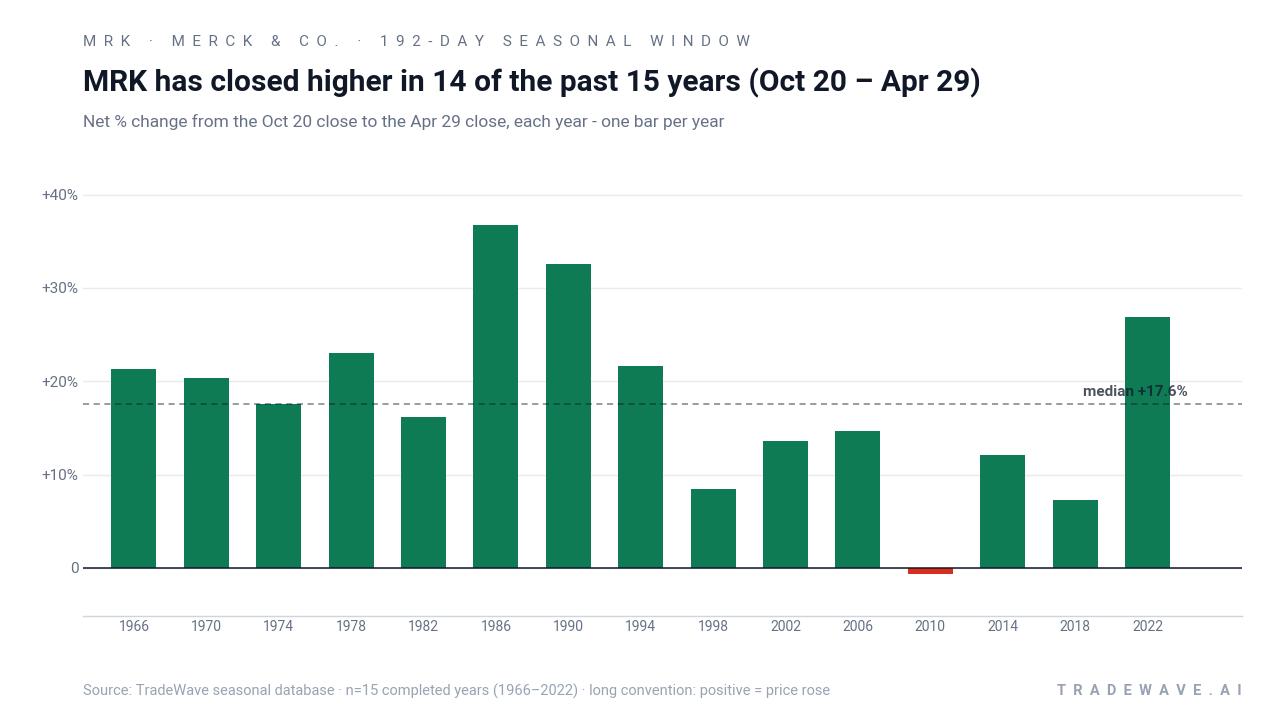
Merck & Co. has risen in 14 of 15 midterm-year Oct 20–Apr 29 windows, with an average gain of 19.45% in winning years.
- 14-for-15 record in this window, with winning years averaging 19.45% gains and only one small losing year.
- The upcoming Oct 20–Apr 29 stretch spans 192 days and has historically been a strong bullish seasonal window for MRK in midterm election years.
- Percent Profitable sits at 93.33%, with 14 winners and 1 loser across the last 15 qualifying cycles.
- Avg Profit - All, which includes the lone losing year, is still a hefty 18.11%, showing how dominant the upside has been.
- Intraperiod swings have been meaningful, with some years seeing double-digit drawdowns even as the window finished higher.
- The pattern aligns with the late phase of the midterm election year, just before the historically supportive pre-election year begins.
According to historical data from TradeWave.ai, this midterm-year autumn-to-spring stretch has behaved very differently from an average calendar window for Merck & Co., and the next iteration is less than a month away.
How has Merck & Co. (MRK) traded in the Oct 20–Apr 29 midterm-year window?
Merck & Co. has rallied in 14 of the last 15 midterm-year Oct 20–Apr 29 windows, turning that six-month stretch into one of the stock’s most reliable bullish regimes. Shares finished the prior session at 149.50, up 1.8% on the day and ahead 5.6% year to date, leaving the stock only about 3.6% below its 52-week high. With the market wrapping up the midterm election year and heading into the historically supportive pre-election year, this specific MRK seasonal trend stands out as unusually consistent.
The presidential election cycle matters here because this pattern is built only from the last 15 midterm election years, not from every calendar year. Midterm years often bring policy noise and rate uncertainty early on, followed by a more constructive tone as markets look ahead to the pre-election year, and MRK’s historical seasonality in this window lines up with that late-cycle risk-on shift.
Across those 15 midterm-year samples, the trade direction is long and the bias has been clear. Percent Profitable is 93.33%, with 14 winners and just 1 loser, and the average gain in winning years is 19.45% compared with an all-years average of 18.11%. The lone down year, 2010, saw a modest 0.63% loss, which is small relative to the double-digit gains logged in many of the winning cycles.
The per-year breakdown shows how that plays out in practice. Strong years like 1986 and 1990 delivered net returns of 36.7% and 32.58% respectively, while more recent cycles such as 2022 posted a 26.88% gain over the same Oct 20–Apr 29 window. Softer but still positive years, including 1998 and 2018, came in with single-digit to low-teens gains, yet they still added to the cumulative seasonal climb.
Intraperiod swings have been meaningful. In 2010, the one losing year, the worst drawdown from entry reached 14.14% even though the final loss was less than 1%, showing how a long trade could be underwater for months before recovering. In contrast, some of the strongest years, such as 1986 and 1990, saw maximum favorable moves of 55.32% and 42.43% with adverse excursions contained to single digits, a profile that fits a trending tape with manageable pullbacks.
The historical seasonal average suggests that strength often builds as the window progresses rather than spiking only at the start. Trend statistics show 60 long-biased days versus just 2 short-biased days across the full window, and even when you zoom into shorter segments there are 48 long-leaning days against 5 short-leaning days. That points to a pattern where rallies tend to persist across the winter and early spring rather than fizzling after an early burst.
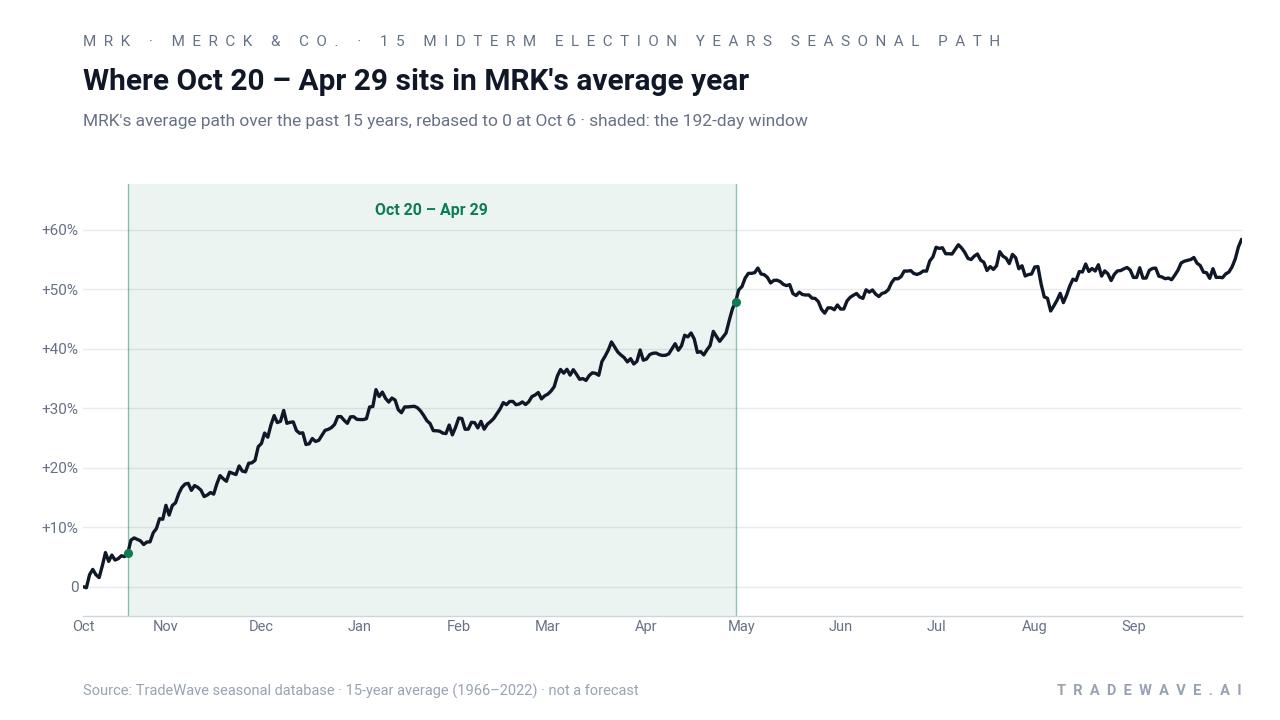
Yearly net and peak moves highlight upside persistence amid typical drawdowns.
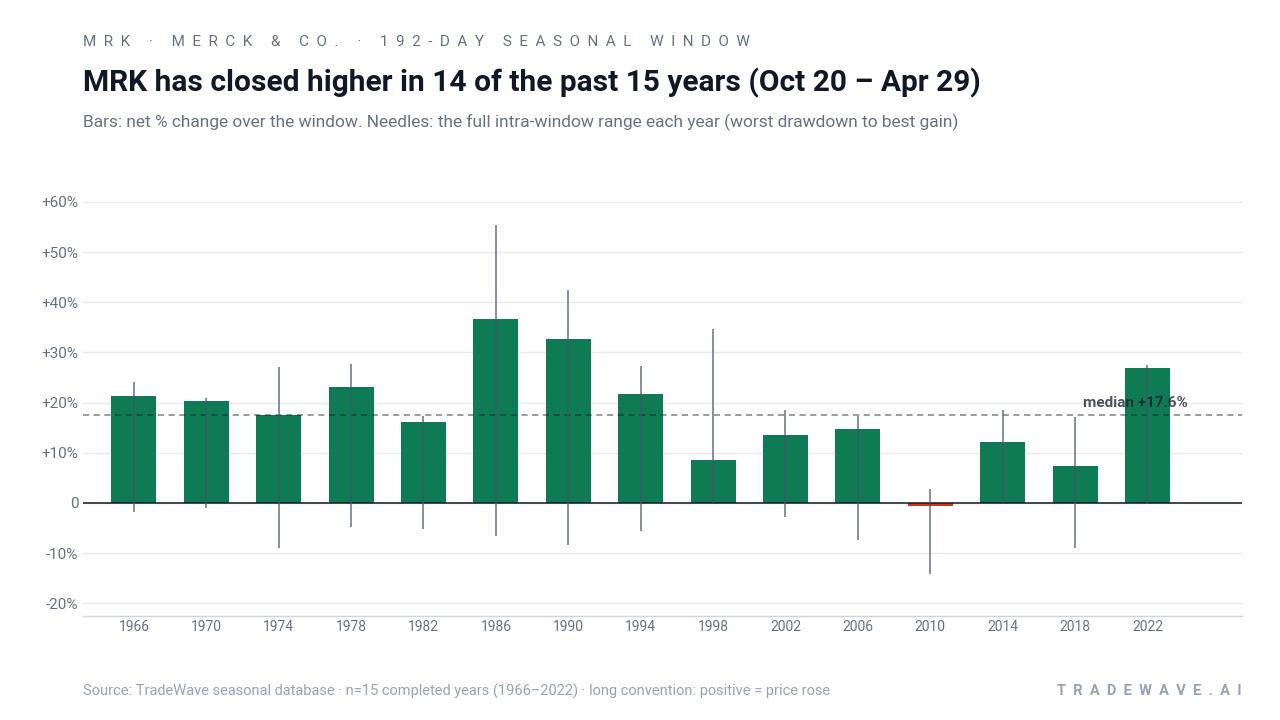
The stacked net, best-case and worst-case excursions underline that this is a high-conviction but not low-volatility pattern. Maximum favorable moves have often pushed well beyond the final net gain, while maximum adverse moves in several years reached mid- to high-single digits before the stock recovered. Add it up: 14 winners out of 15 and more than 1,000% cumulative return across these midterm-year windows, but with enough noise inside the range to punish weak risk management.
History does not guarantee future results; adverse excursions (MAE) can be large even in winning windows.
Why does Merck & Co. (MRK) follow this seasonal pattern?
This midterm-year autumn-to-spring strength likely reflects a mix of earnings timing, sector rotation and policy expectations. One likely driver is that MRK’s key oncology and vaccine franchises often see guidance updates and pipeline news around year-end and early spring, which can pull institutional money into large-cap pharma as investors reposition portfolios for the coming year.[3] Analysts have also pointed to the broader pattern of risk appetite improving as markets move from the uncertainty of the midterm election year into the historically stronger pre-election year, a backdrop that can favor defensive growth names like Merck.[4]
What is driving Merck & Co. (MRK) today?
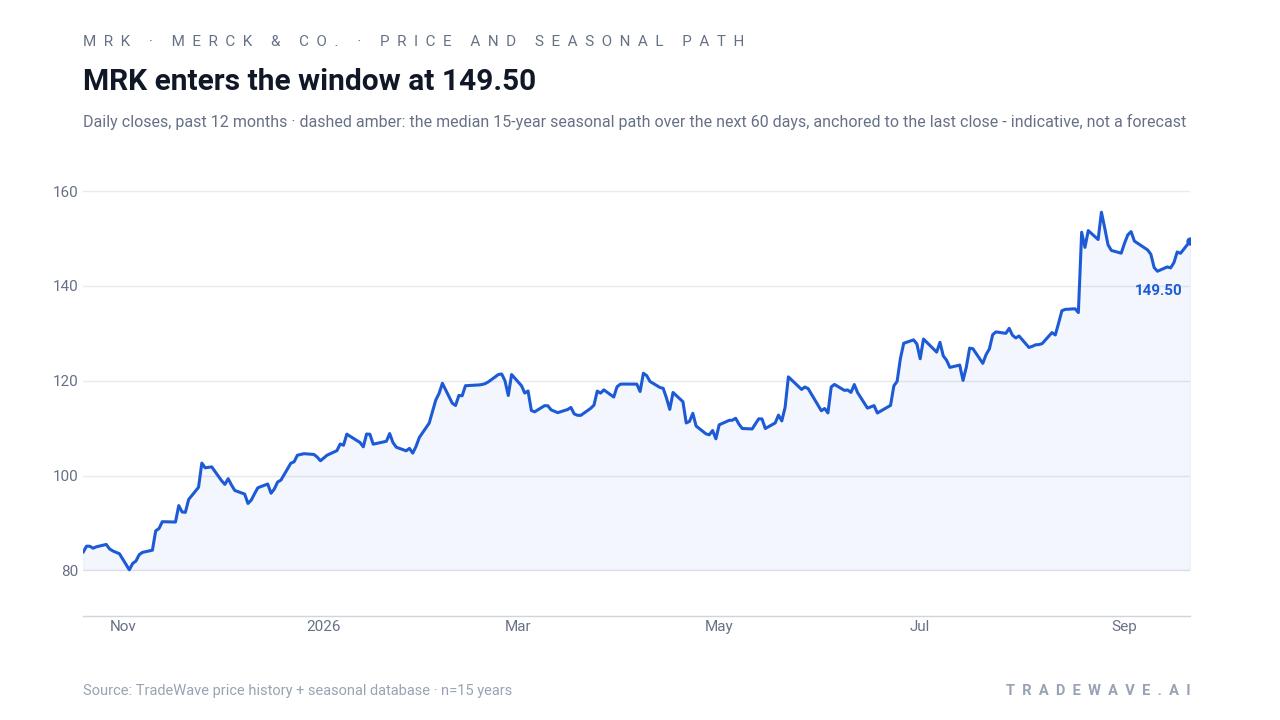
Merck & Co. closed at 149.50 in the prior session, up 1.8% on the day and 5.6% year to date, as investors continue to weigh its oncology pipeline against looming patent expiries. The stock has more than doubled from its 52-week low of about 73.22 and sits roughly 3.6% below its 52-week high near 155.08, a reminder of how powerful the recent run has been for a defensive healthcare name.
In Oct 2025, Merck reported Q3 2025 revenue of $17.28 billion, ahead of estimates, with adjusted earnings of $2.58 per share as blockbuster cancer drug Keytruda offset weaker Gardasil vaccine sales.[3] The company narrowed full-year 2025 revenue guidance to $64.5 billion to $65.0 billion and projected earnings of $8.93 to $8.98 per share, reinforcing the view that Merck is leaning on oncology and new growth drivers to bridge the coming loss of exclusivity for Keytruda.[3]
Strategically, Merck has been reshaping its cancer portfolio. In Jan 2026, reports surfaced that the company was in talks to acquire Revolution Medicines for about $30 billion, a move aimed at bolstering its oncology pipeline with targeted therapies.[2] By Mar 2026, Reuters reported Merck was nearing a roughly $6 billion all-cash deal for Terns Pharma, again focused on cancer assets, underscoring management’s willingness to deploy capital to sustain growth beyond its current blockbusters.[6]
On the macro side, Merck has outlined an ambitious long-term revenue plan. In Jan 2026, the company said it sees $70 billion in revenue from new growth opportunities by the mid-2030s, with increased expectations for cardiometabolic, respiratory and infectious disease portfolios alongside oncology.[4] That long runway, if delivered, could keep MRK in the mix for investors looking for a blend of defensive earnings and secular growth as the policy backdrop evolves into the pre-election year.
The chart below situates the latest move in its recent multi-month context alongside the median seasonal path.
What should traders watch as this MRK seasonal window approaches?
With the Oct 20 start date less than a month away, the key watchpoint is whether MRK can hold above its 50-day moving average near 136.94 while trading close to its 52-week high. A firm base in the 140–150 zone as the window opens would be consistent with prior strong cycles, where rallies often built on already elevated levels rather than snapping back from deep selloffs.
Fundamentally, any updates on Merck’s oncology strategy, including progress on potential deals like Terns Pharma or other pipeline additions, will matter for how investors lean into this window.[6] Traders will also be watching for fresh commentary on the company’s long-term $70 billion new-revenue target, since confidence in that plan has been a key part of the bull case.[4]
From a seasonal standpoint, behavior inside the window will be telling. A pattern of higher lows and contained drawdowns, similar to years like 1986, 1990 or 2022, would line up with the historical script of strong midterm-year autumn-to-spring performance. A sharp break below recent support with deeper-than-usual intraperiod drawdowns would be an early sign that this cycle might diverge from the 14-for-15 track record.
Sources
- Forbes - Why Is Merck Stock Surging?
- Seeking Alpha - Key deals this week: Merck, Glencore, CrowdStrike, Marvell Technology, Steel Dynamics and more
- Reuters - Merck posts higher third-quarter sales as Keytruda growth offsets drop from Gardasil
- Reuters - Merck says new growth opportunities to drive revenue of $70 billion by mid-2030s
- Forbes - Is Merck Stock’s Run Legitimate?
- Reuters - Merck nears $6 billion acquisition of Terns Pharma to boost cancer portfolio, FT reports
About this seasonal analysis
Seasonal pattern data is sourced from TradeWave.ai, which analyzes historical price behavior across annual calendar windows going back up to 30 years. Read the full data methodology or the book The 100-Year Pattern by Afshin Moshrefi (2026 edition). Past performance of seasonal patterns does not guarantee future results. This article is for informational purposes only and does not constitute investment advice.