Micron Technology (MU) Has Rallied in 10 of 10 Late-October Windows, Averaging 5.98% Gains
Micron Technology is approaching a 15-day late-October window that has been quietly powerful for the stock, just as shares trade near record highs on AI memory demand and bullish analyst sentiment.
Price as of Sep 29, 2026: $1,065.08 (last close).
What is the seasonal pattern for Micron Technology (MU)?
Micron Technology has risen in 10 of 10 years during this late-October window, with an average gain of 5.98% in winning years.
- 10 for 10 in this window, averaging 5.98% gains in winning years across the past decade.
- Seasonal window runs from Oct 23 through Nov 6, covering 15 calendar days of trading.
- Percent Profitable is 100.0%, with 10 winners and 0 losers over the 10-year lookback.
- Average winner gain of 5.98% comes with a TradeWave Ratio of 1.73, showing meaningful travel in the long direction within the window.
- Sharpe ratio of 1.36 indicates a historically favorable risk-adjusted profile for this MU seasonal trend.
- Individual years have still seen notable intraperiod drawdowns, so timing and risk controls matter even in a strong pattern.
According to historical data from TradeWave.ai, Micron’s late-October behavior has not looked like an average month on the calendar. The next section steps through what that pattern has looked like and how it lines up with today’s backdrop.
How has Micron Technology (MU) traded in the late-October window?
Micron Technology has closed higher in every single Oct 23 to Nov 6 window for the past 10 years, averaging a 5.98% gain across those 15-day stretches. The next iteration of that window begins on Oct 23, with the stock last changing hands at 1,065.08 after a 1.1% move in the prior session and trading not far from its 52-week high of 1,254.61. That combination of a strong MU seasonal trend and elevated price levels gives this year’s window more weight than usual for traders watching the memory-chip leader.
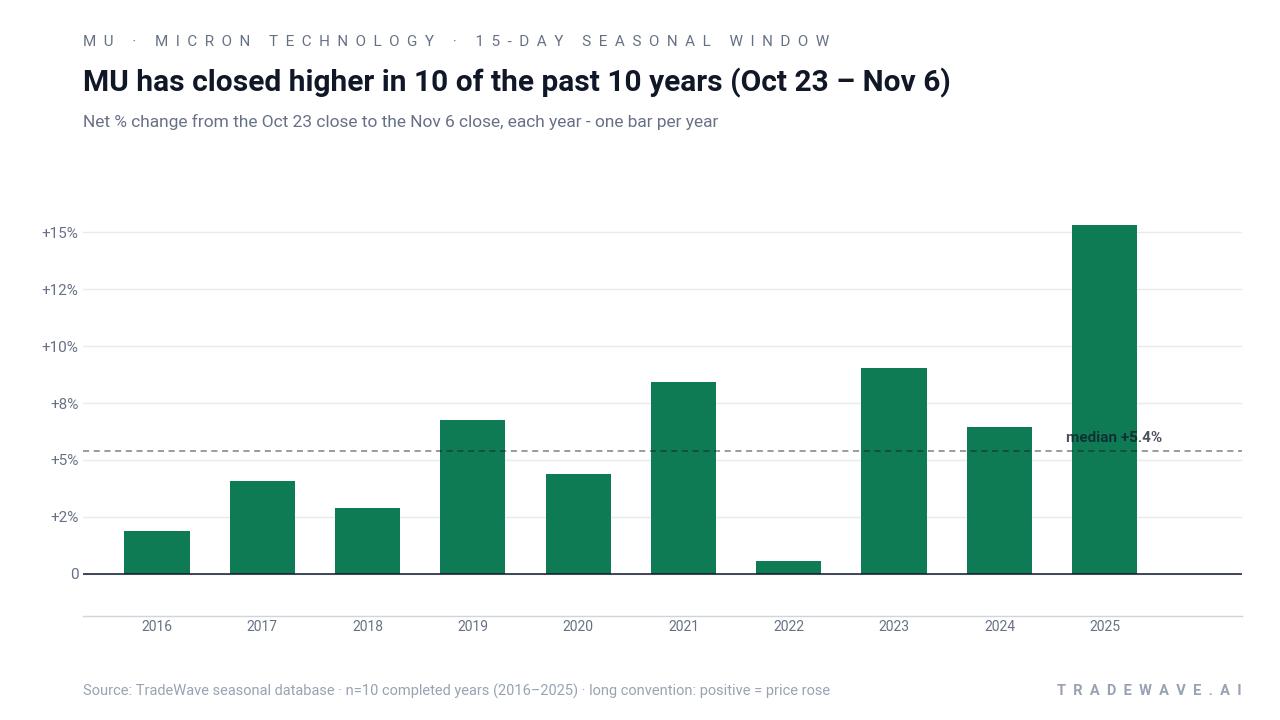
Across the 2016 to 2025 sample, the long trade direction has been firmly aligned with the outcome: 10 winners, 0 losers and a 100.0% hit rate. Average gains of 5.98% mask a range of outcomes, from a modest 0.57% advance in 2022 to a 15.3% surge in 2025, but every year finished the 15-day MU trading window in positive territory.
Looking at individual years, 2025 stands out as the strongest run, with Micron rallying 15.3% between a 206.51 entry and a 238.10 exit. On the softer side, 2016 delivered just 1.88% from entry to exit, and 2022 barely cleared the bar with that 0.57% gain, reminding traders that even a perfect win record can include flat-feeling stretches.
A second view stacks net returns with the full intraperiod range to show how far MU has tended to swing inside the window.
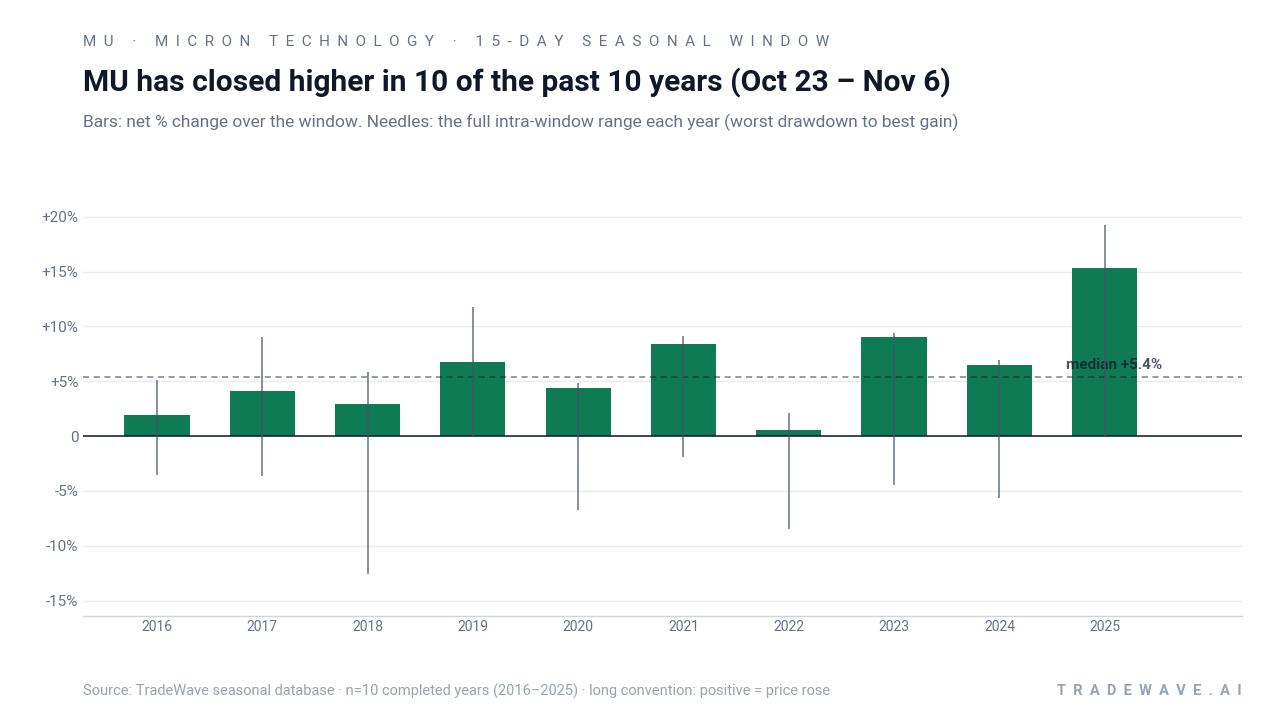
The maximum favorable move and maximum adverse move profile shows why this MU seasonal pattern has attracted attention. In strong years such as 2019 and 2025, the best intraperiod rallies reached 11.73% and 19.21% respectively, while even quieter years like 2016 still saw a 5.1% peak run-up before settling. On the downside, several years carried meaningful drawdowns inside the window, including a worst intraperiod drop of 12.56% in 2018 and 8.5% in 2022, underscoring that the path to a higher close has not been a straight line.
Trend statistics back up the visual impression. The “Trend Long” and “Trend Long1” counts, at 56 and 57 versus just 4 and 5 on the short side, point to a pattern where more of the daily steps inside the window have leaned higher rather than lower. The cumulative return chart, which compounds each year’s 15-day result, climbs to 77.42% over the decade, a sign that this specific MU seasonal window has delivered a steady tailwind when stacked year after year.
Put simply, the pattern is clear: this late-October stretch has favored long exposure in Micron for 10 straight years, with solid average gains and enough volatility inside the window to matter for active traders.
Why does Micron Technology (MU) follow this seasonal pattern?
One likely driver is Micron’s position in the semiconductor cycle, where late October often sits between major earnings updates and ahead of year-end positioning by large institutions. Analysts have pointed to AI-driven data center demand and memory-price inflection points as catalysts that cluster in the back half of the year, which can amplify flows into high-beta chip names like MU.[1] This late-October MU seasonal pattern may also reflect portfolio managers adding exposure to leading AI and memory plays before liquidity thins into the holidays.
History does not guarantee future results; adverse excursions inside the window have been large in some years even though every sample year finished with a gain.
What is driving Micron Technology (MU) today?
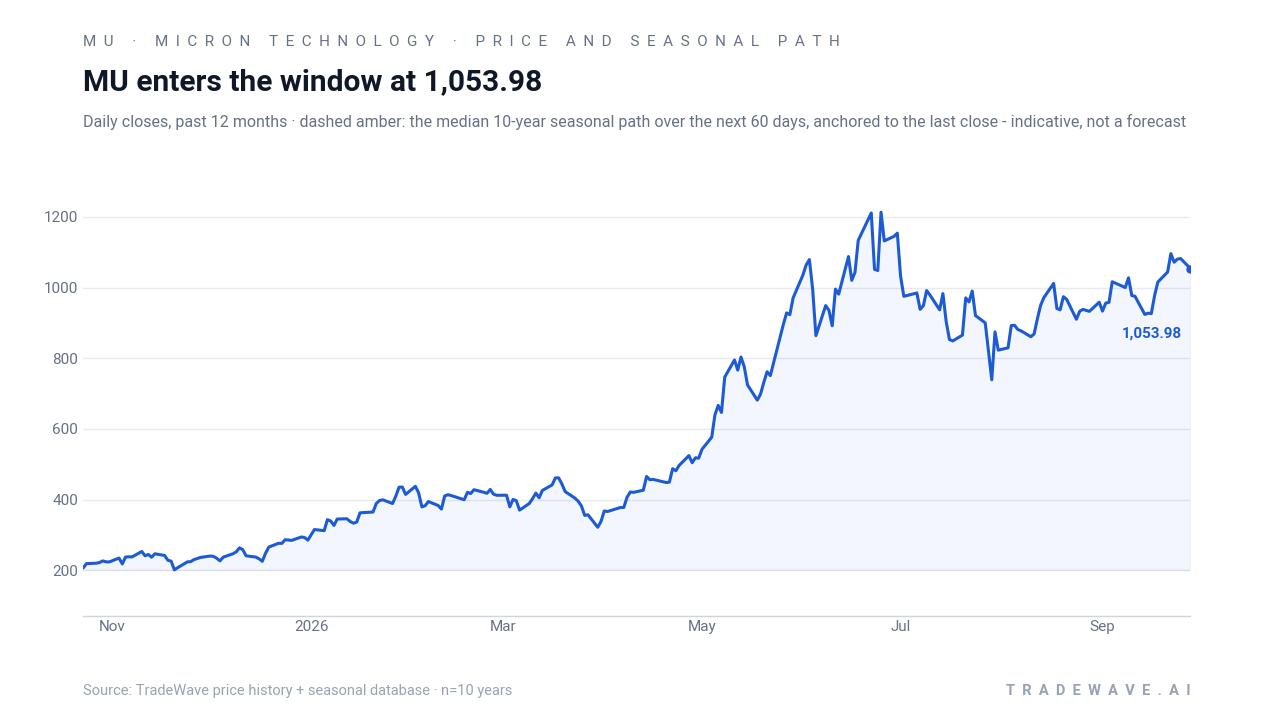
Micron closed the prior session at 1,065.08, up 1.1% on the day, leaving the stock about 15.1% below its 52-week high of 1,254.61 and far above its 52-week low of 154.68. The move extends a powerful run that has seen MU repeatedly test new territory as investors crowd into AI infrastructure plays and memory suppliers tied to data center buildouts.[1]
On Sep 28, Barchart highlighted that analysts remain firmly in the “Strong Buy” camp on Micron, with a consensus price target of 1,476.64 from its coverage summary, implying Wall Street still sees upside from current levels.[1] That target reflects a very different price regime than the one MU traded in earlier this year, but the tone of the coverage has stayed consistent: Micron is viewed as one of the cleanest ways to play the AI memory cycle.
Back in March 2026, a Seeking Alpha preview flagged short interest at 2.61%, a relatively low level for a stock that has more than sextupled from its 52-week low.[2] That modest bearish positioning, combined with strong fundamental momentum, has limited the fuel for sharp squeezes and instead supported a more orderly grind higher.
Micron’s fundamental story has been building all year. In March 2026, the company reported fiscal Q2 revenue of 23.86 billion dollars, beating consensus estimates of 19.51 billion dollars, with earnings per share of 12.20 also ahead of expectations.[3] In June 2026, a Yahoo Finance earnings preview noted that Q3 revenue was expected around 35.5 billion dollars with EPS near 20.39, reflecting sky-high demand from AI data centers and tight DRAM and NAND markets.[4]
Sector context has been equally supportive. In May 2026, Yahoo Finance reported that Micron stock “keeps jumping” as memory prices soar, with tight fundamentals across DRAM and NAND helping to lift the entire memory complex.[6] That backdrop has reinforced the idea that MU is not just riding a broad tech rally but is also benefiting from specific supply-demand tailwinds in its own corner of the semiconductor sector.
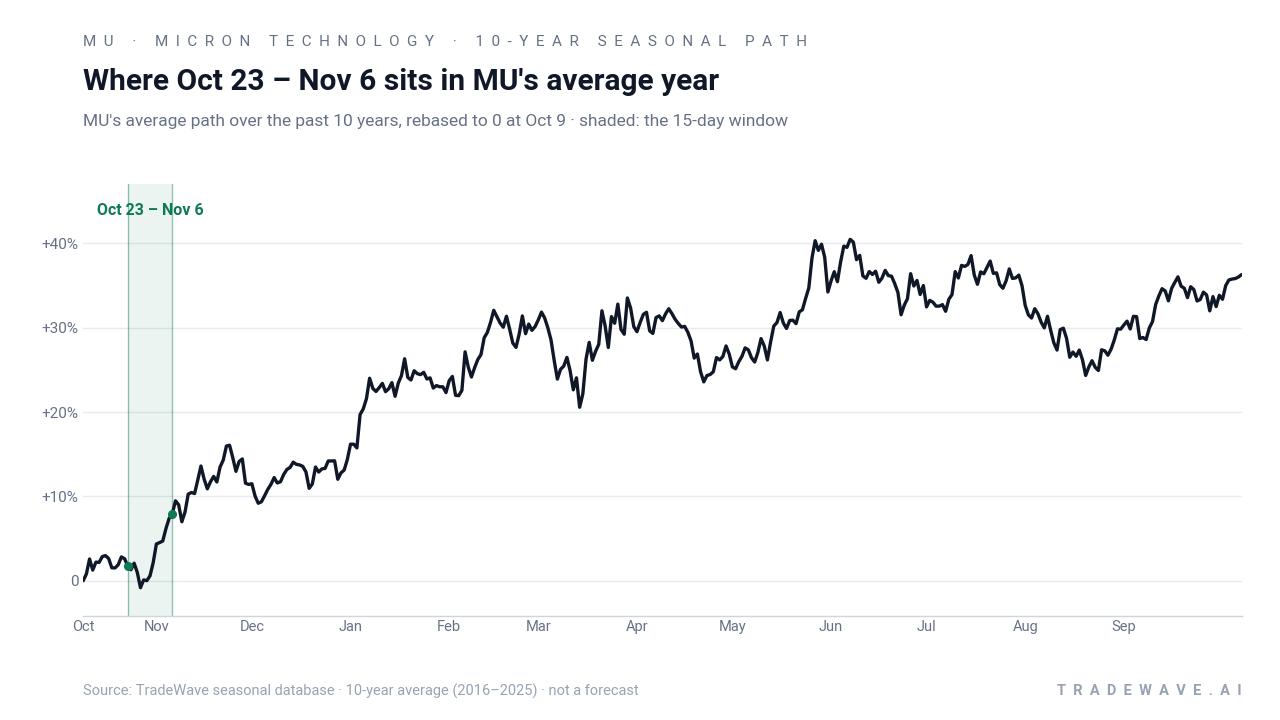
The chart below shows how Micron’s latest move fits into its past year of trading, alongside a historical seasonal projection for the next two months.
What should traders watch as Micron enters this seasonal window?
First, the calendar. The 15-day MU trading window opens on Oct 23 and runs through Nov 6, a period that has historically delivered consistent upside but also sharp intraperiod swings. Traders will be watching whether the stock respects prior support zones near the 50-day moving average, currently around 945.72, if volatility picks up into the window.
Second, earnings and guidance. While Micron’s next earnings date is not yet set, the company’s last reported quarter and the June Q3 preview both emphasized AI data center demand and high-margin memory pricing as key drivers.[3][4] Any update that shifts that narrative, whether on hyperscaler spending or supply additions, could either reinforce or blunt the usual late-October seasonal strength.
Third, sentiment and positioning. With short interest previously cited at just 2.61% in March 2026, there is limited evidence of aggressive bearish bets to unwind.[2] If that remains the case into late October, the MU seasonal pattern may play out more through steady institutional buying and options-driven flows than through violent short-covering spikes.
Finally, behavior inside the window itself will be the real test of this MU seasonal trend. A pattern of early drawdowns followed by strong closes, similar to 2018 and 2022, would fit the historical template of choppy but ultimately positive late-October trading. A clean, low-volatility grind higher would echo years like 2019 and 2025. A decisive break of the 10-year win streak, especially if it coincides with softer AI commentary or a turn in memory pricing, would be a clear sign that this particular slice of the calendar is losing some of its edge.
Sources
- Barchart.com - Citi Raises Estimates for Micron Ahead of Earnings. How to Play MU Stock Now.
- Seeking Alpha - Micron Q2 Earnings Preview: Expect Another Monster Quarter (NASDAQ:MU)
- Seeking Alpha - Micron Just Smashed Estimates - Buy The Dip (NASDAQ:MU)
- Yahoo Finance - Micron to report third quarter earnings amid sky-high demand from data centers
- Seeking Alpha - Micron options lean bullish ahead of earnings with ~8% move priced in
- Yahoo Finance (via GuruFocus) - Micron Stock Keeps Jumping as Memory Prices Soar
About this seasonal analysis
Seasonal pattern data is sourced from TradeWave.ai, which analyzes historical price behavior across annual calendar windows going back up to 30 years. Read the full data methodology or the book The 100-Year Pattern by Afshin Moshrefi (2026 edition). Past performance of seasonal patterns does not guarantee future results. This article is for informational purposes only and does not constitute investment advice.